
Overview
A tropical cyclone is a rotating, organized system of clouds and thunderstorms that originates over tropical or subtropical waters and has a closed low-level circulation. Tropical cyclones rotate counterclockwise in the Northern Hemisphere. They are classified as follows:- Tropical Depression: A tropical cyclone with maximum sustained winds of 38 mph (33 knots) or less.
- Tropical Storm: A tropical cyclone with maximum sustained winds of 39 to 73 mph (34 to 63 knots).
- Hurricane: A tropical cyclone with maximum sustained winds of 74 mph (64 knots) or higher. In the western North Pacific, hurricanes are called typhoons; similar storms in the Indian Ocean and South Pacific Ocean are called cyclones.
- Major Hurricane: A tropical cyclone with maximum sustained winds of 111 mph (96 knots) or higher, corresponding to a Category 3, 4 or 5 on the Saffir-Simpson Hurricane Wind Scale.
The Atlantic hurricane season runs from June 1st to November 30th. The Atlantic basin includes the Atlantic Ocean, Caribbean Sea, and Gulf of Mexico.
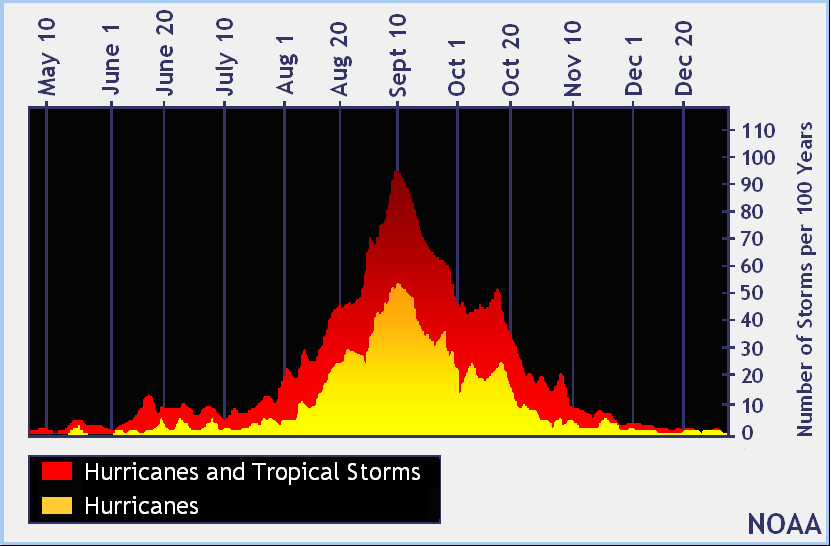
![[graph of average cumulative number of Atlantic basin systems per year]](http://www.nhc.noaa.gov/climo/images/cum-average_Atl_1966-2009.gif) The average cumulative number of Atlantic systems per year, 1966-2009
The average cumulative number of Atlantic systems per year, 1966-2009 |
Number of Tropical Cyclones per 100 Years
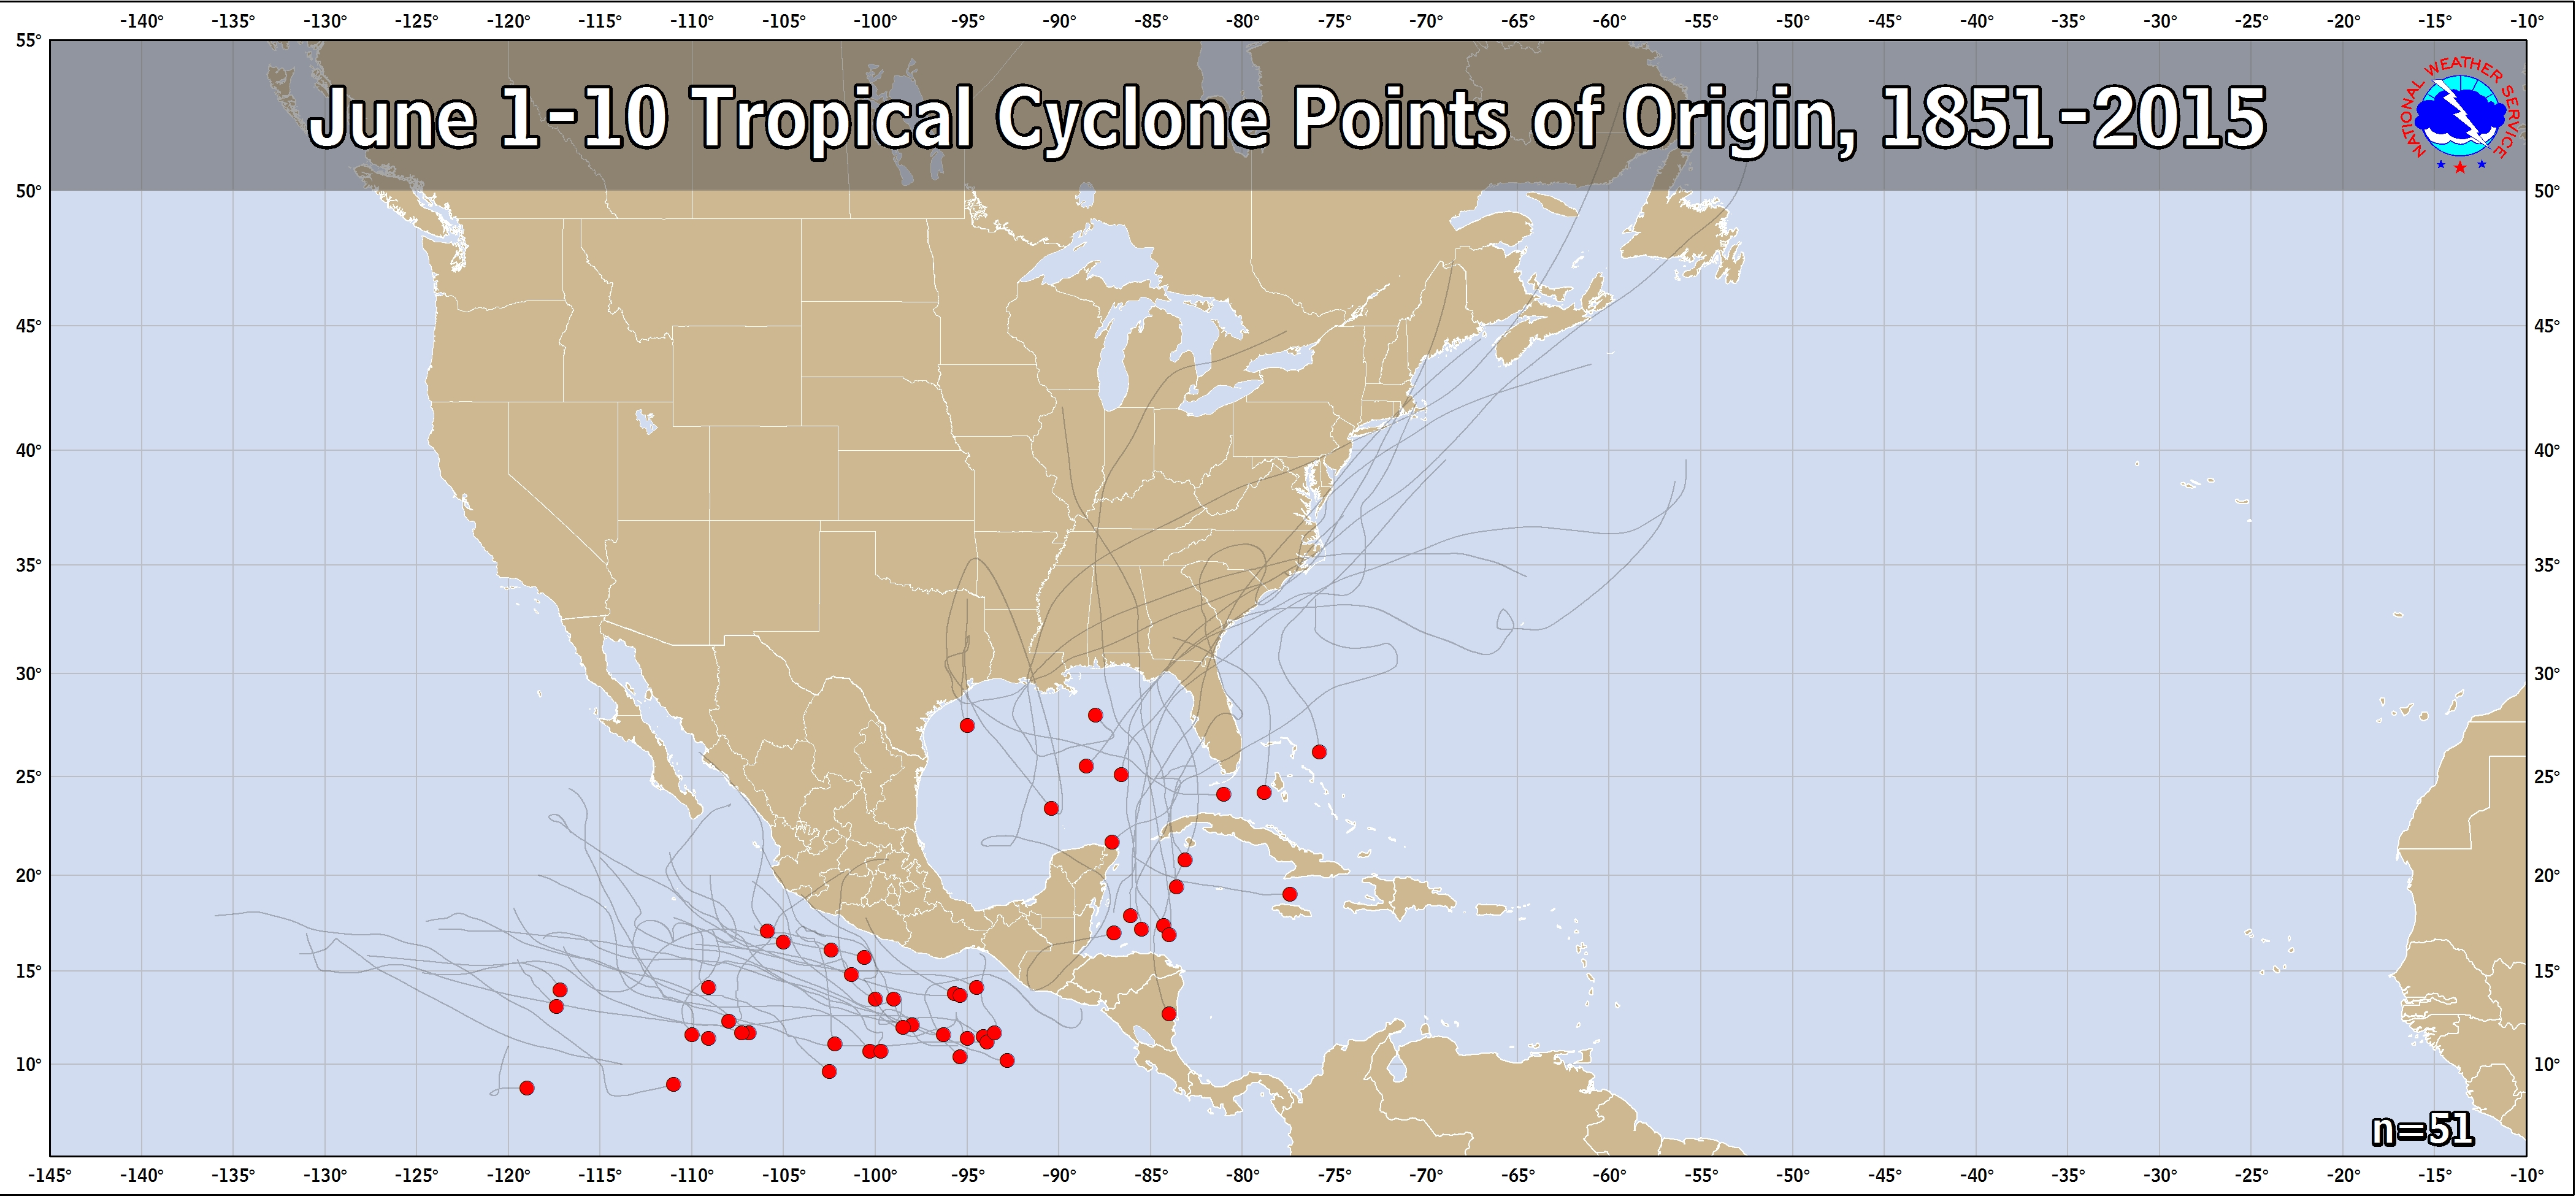
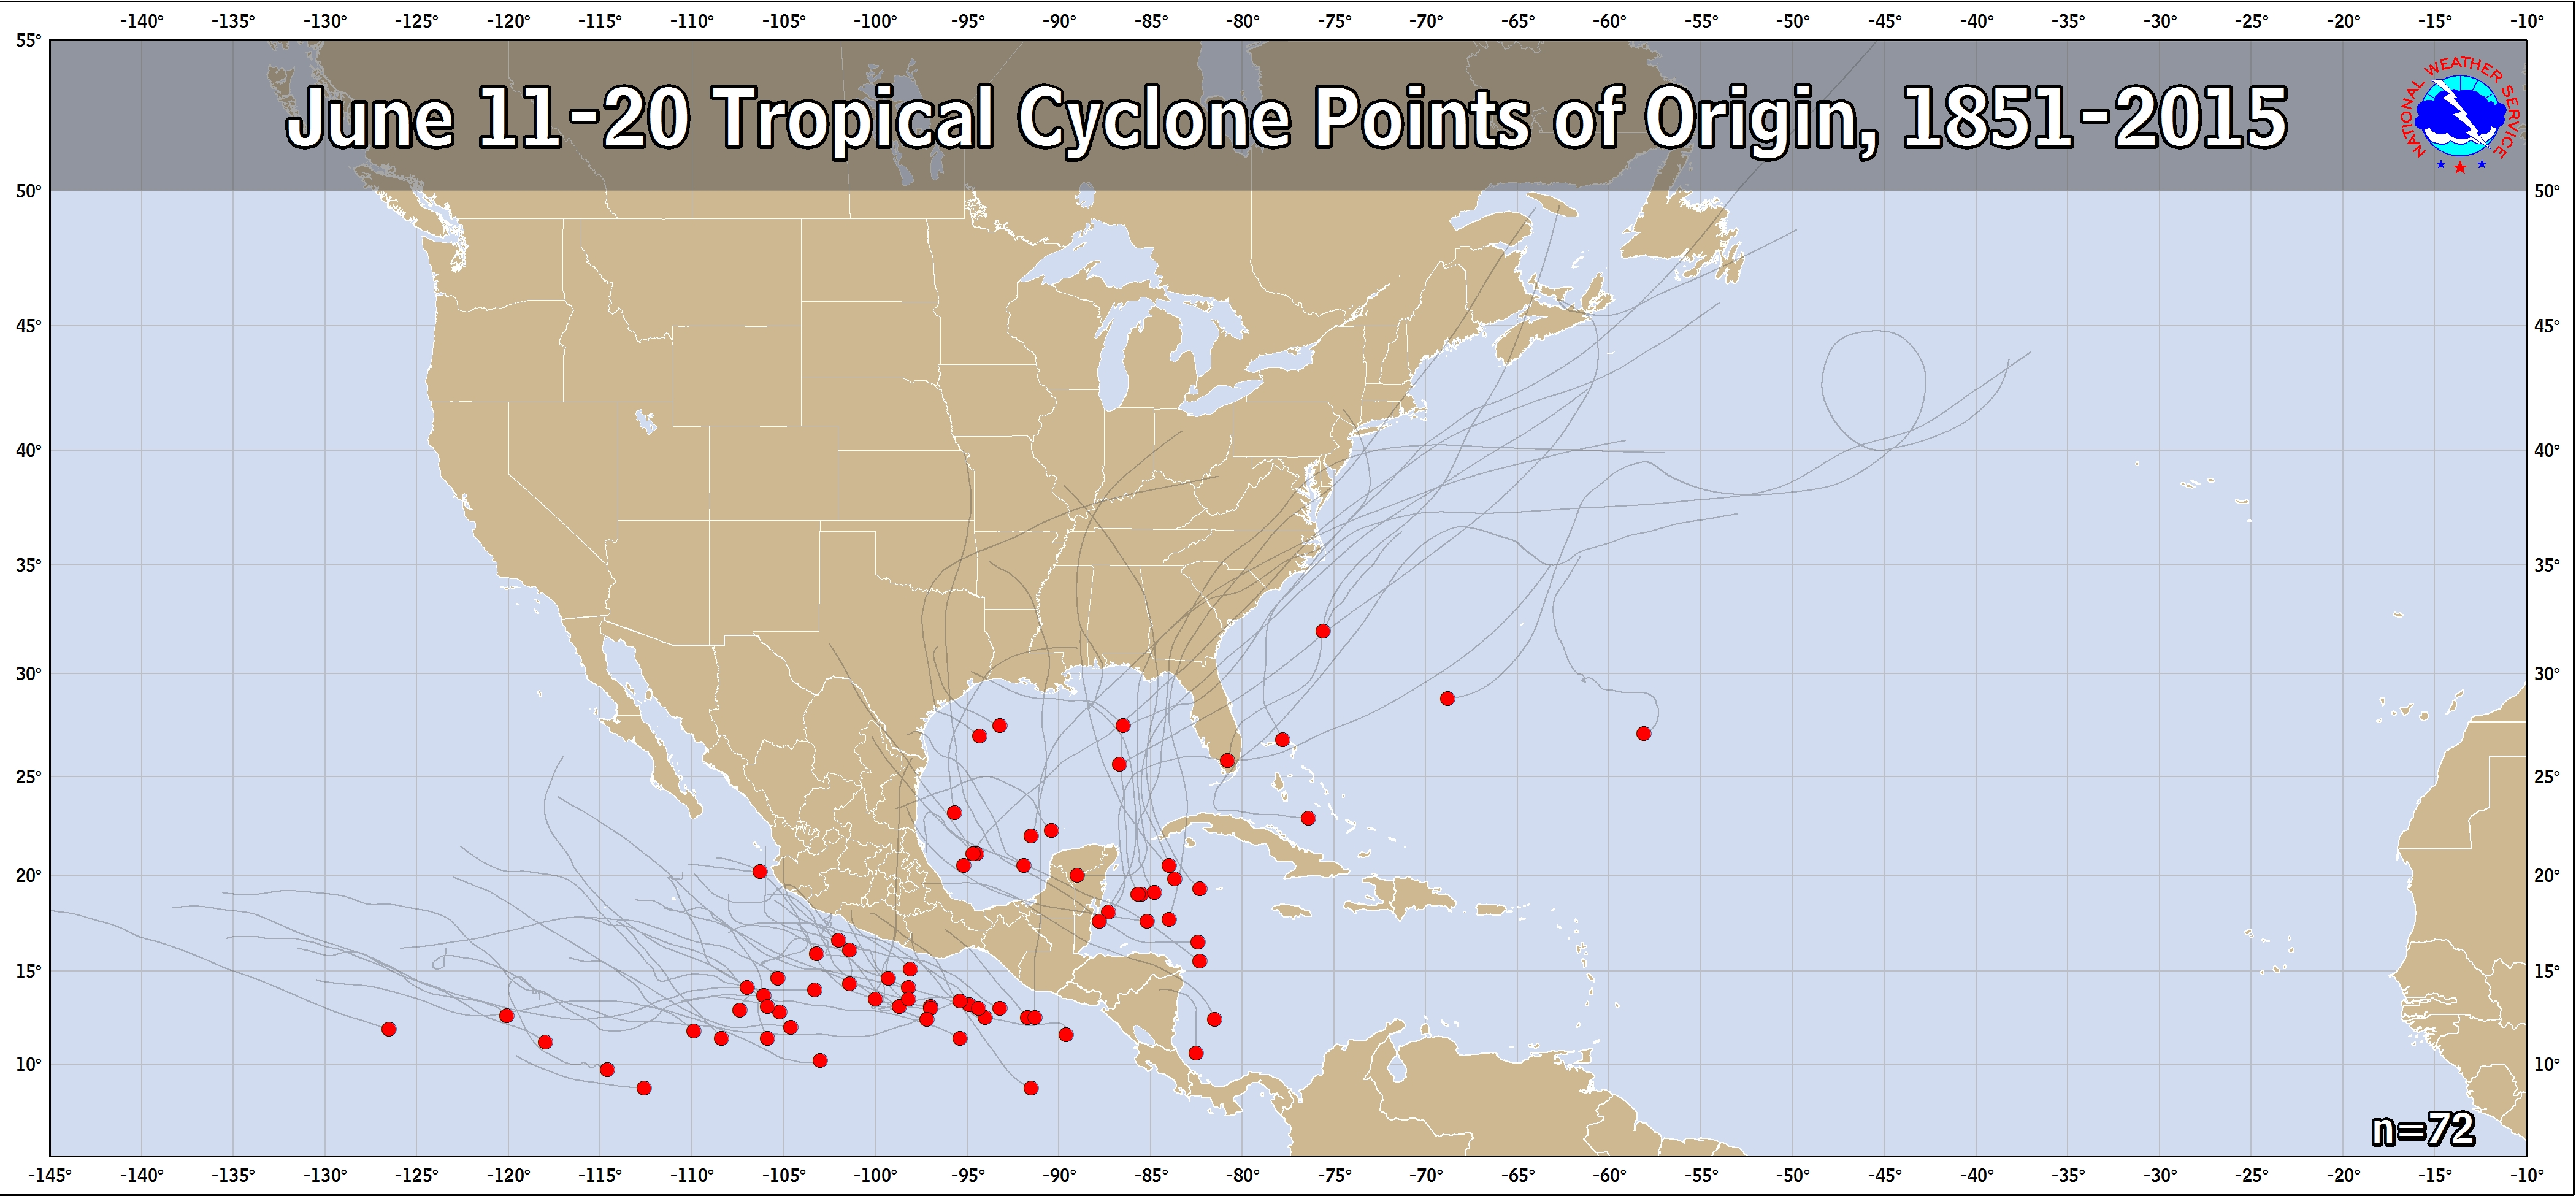
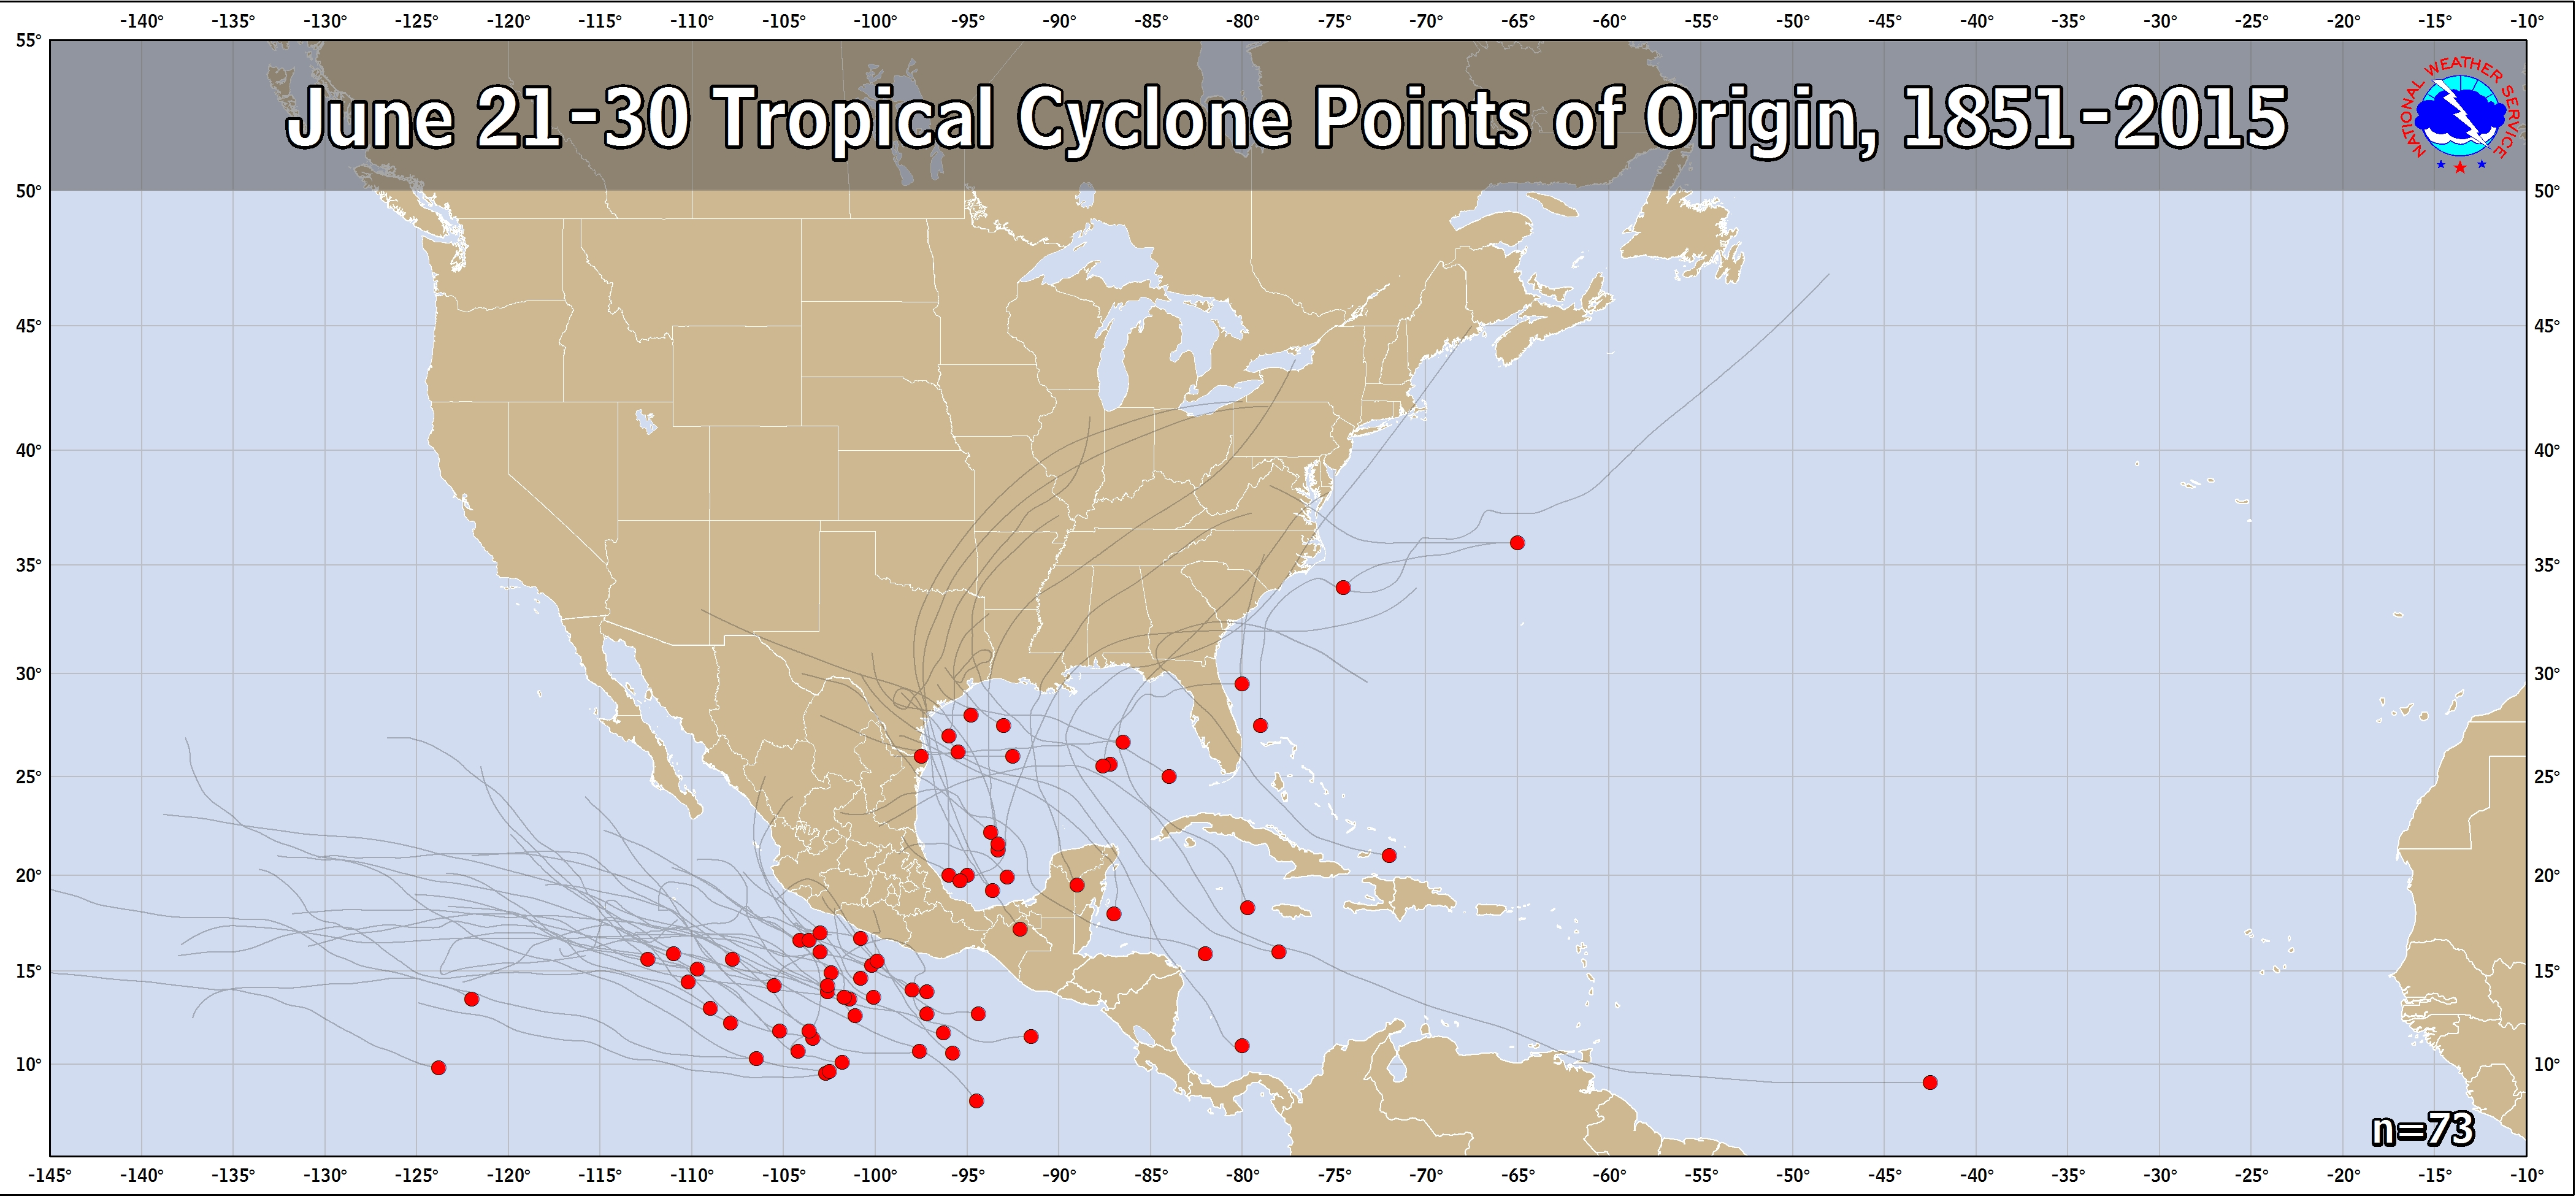
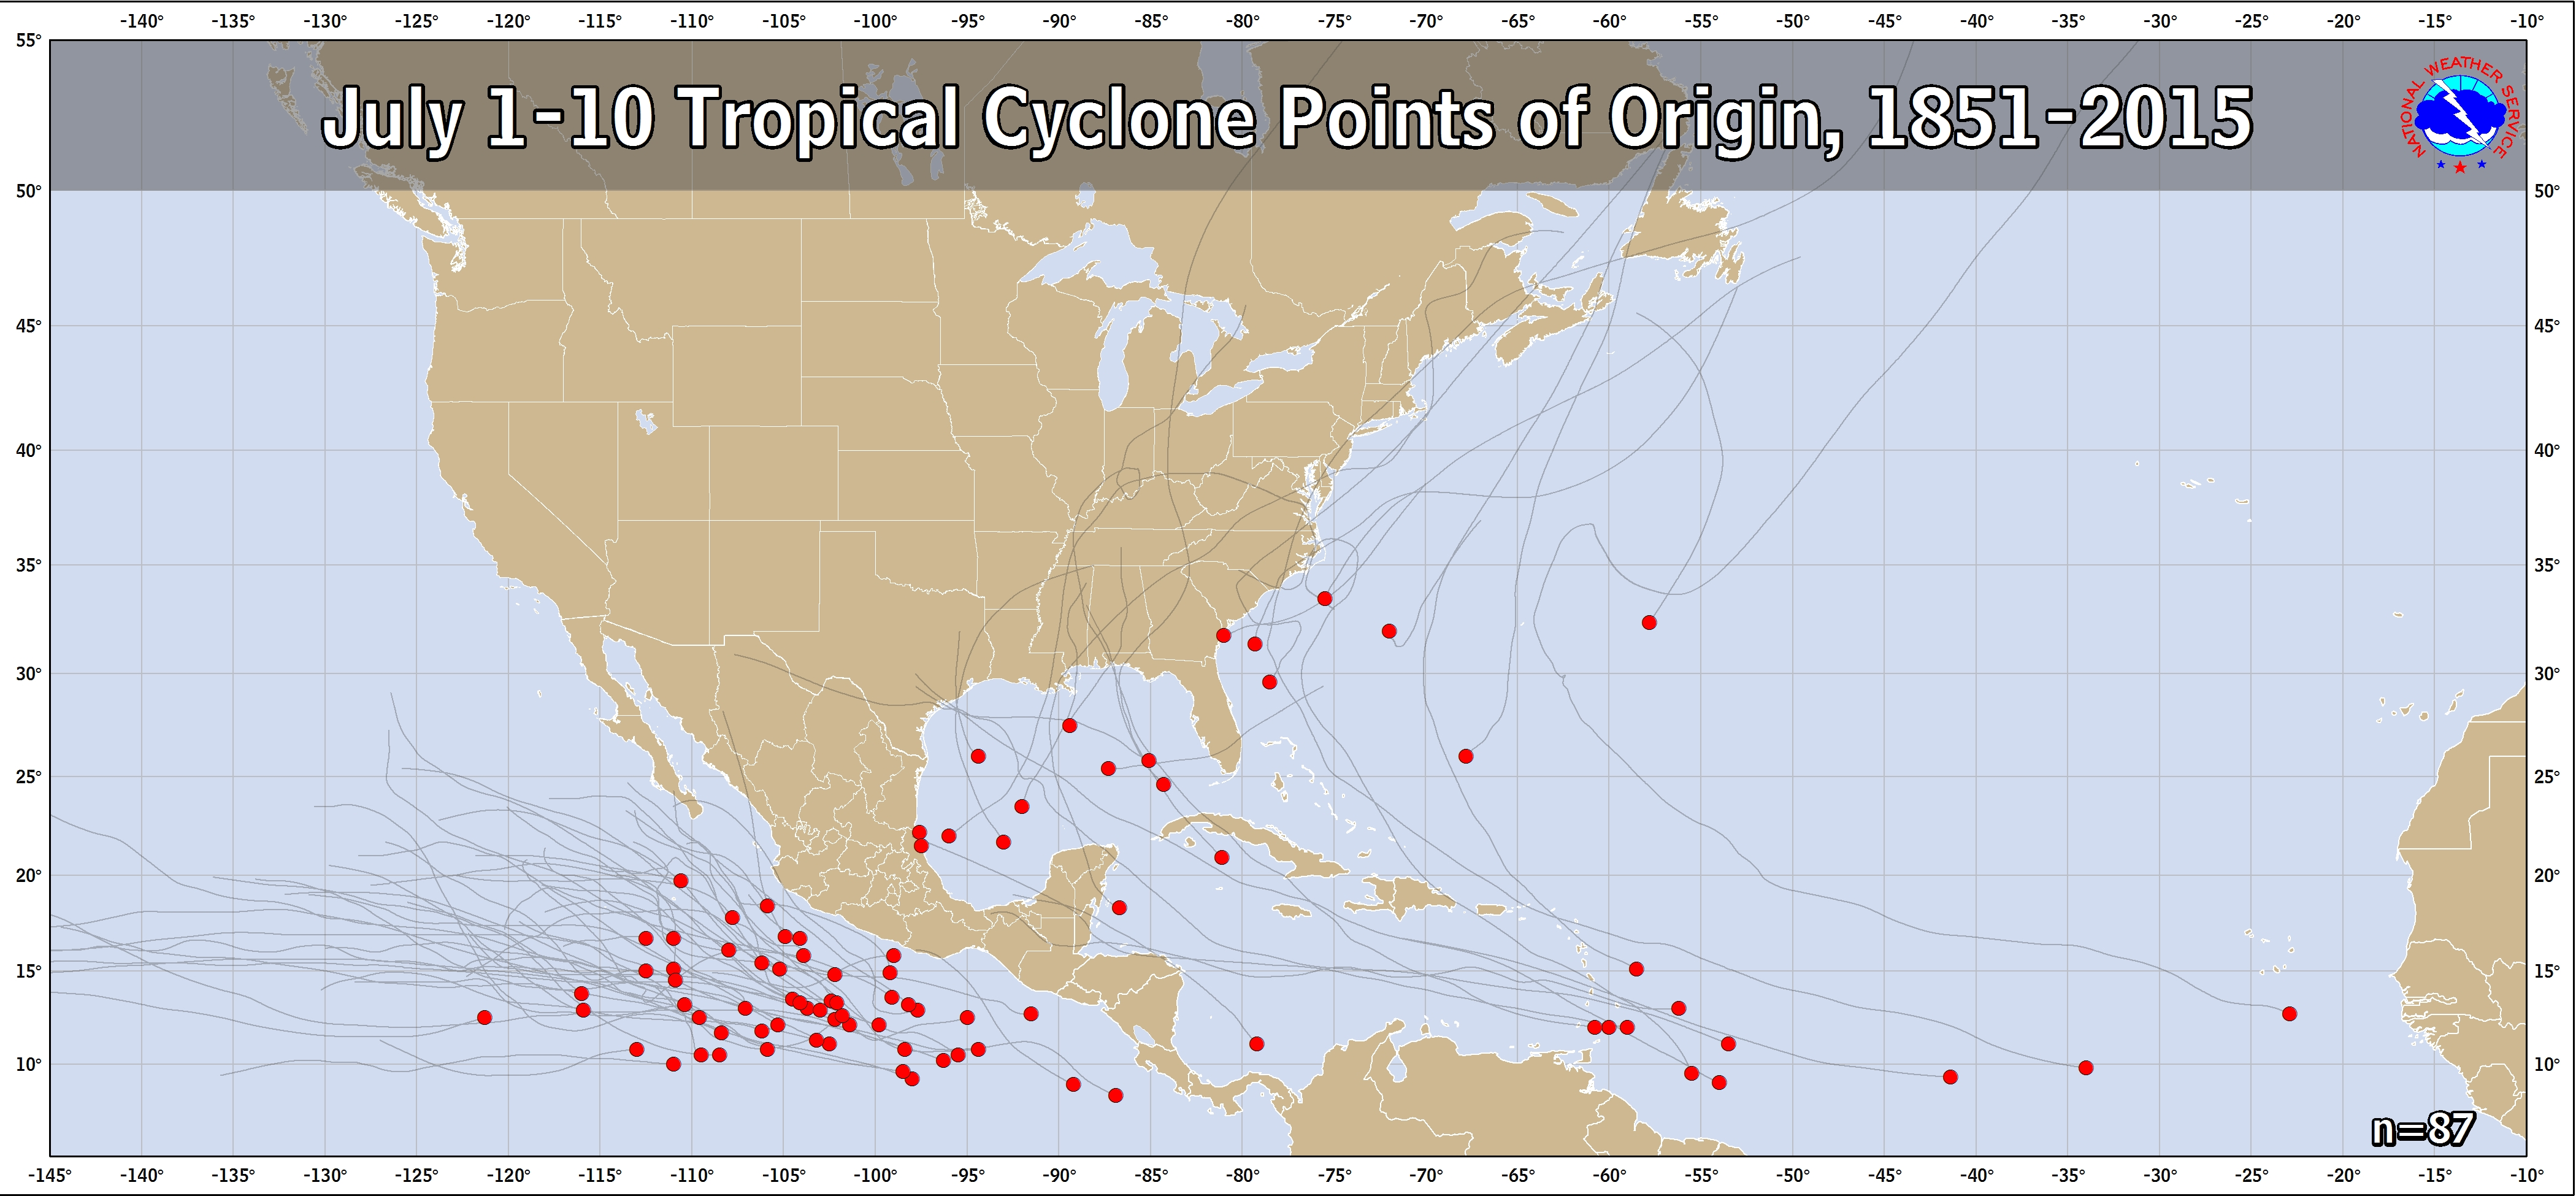
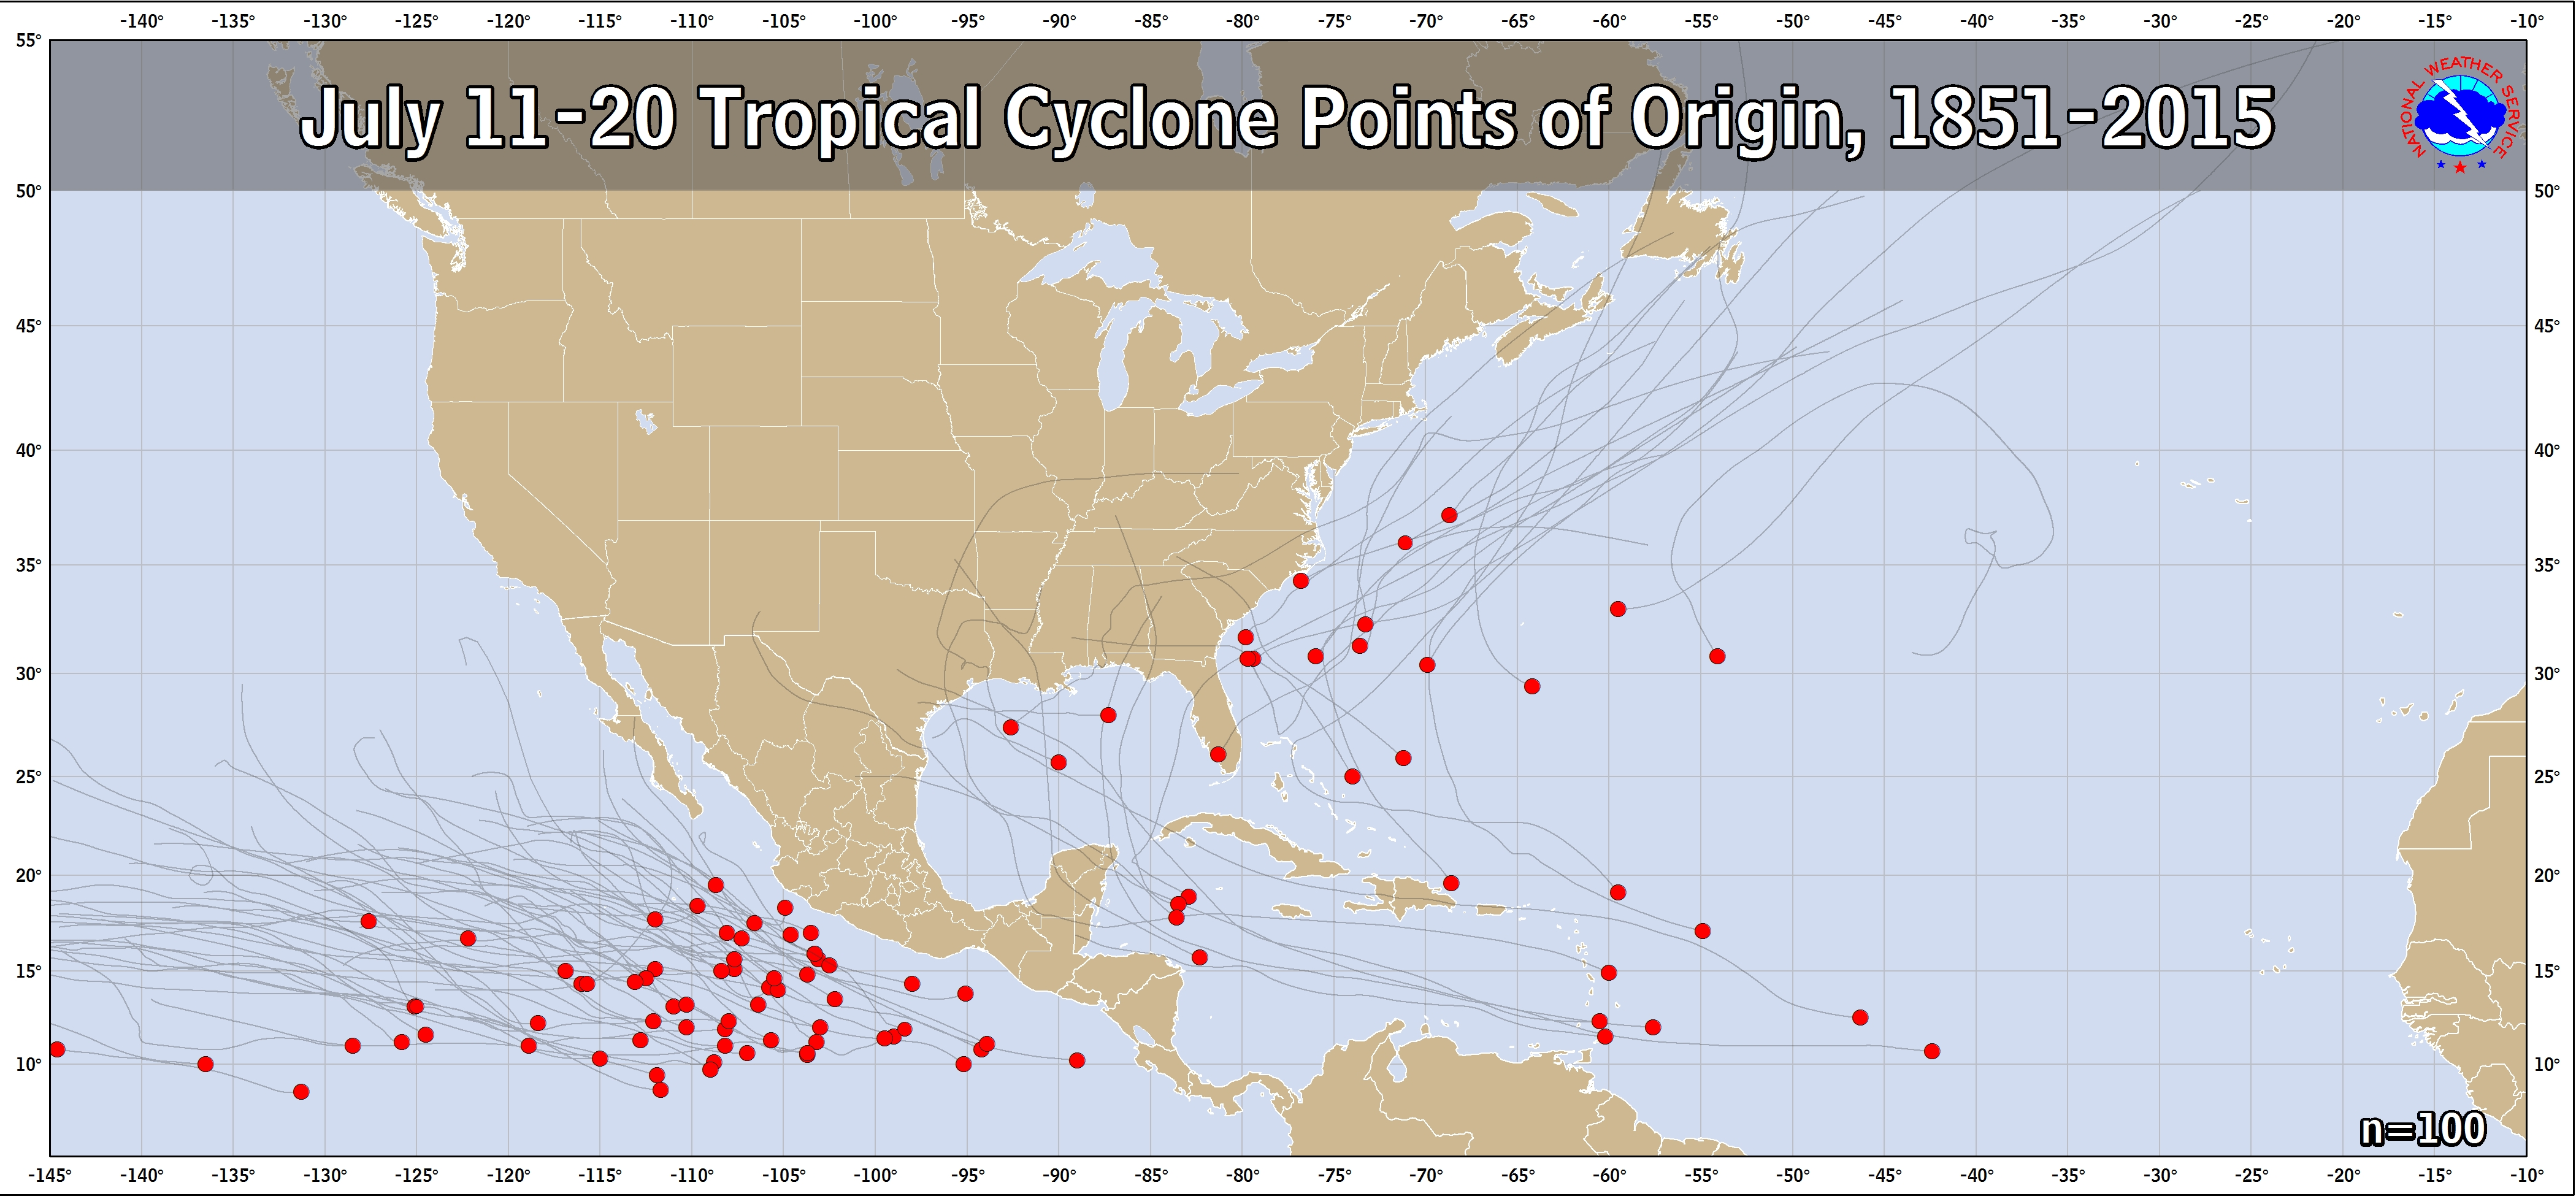
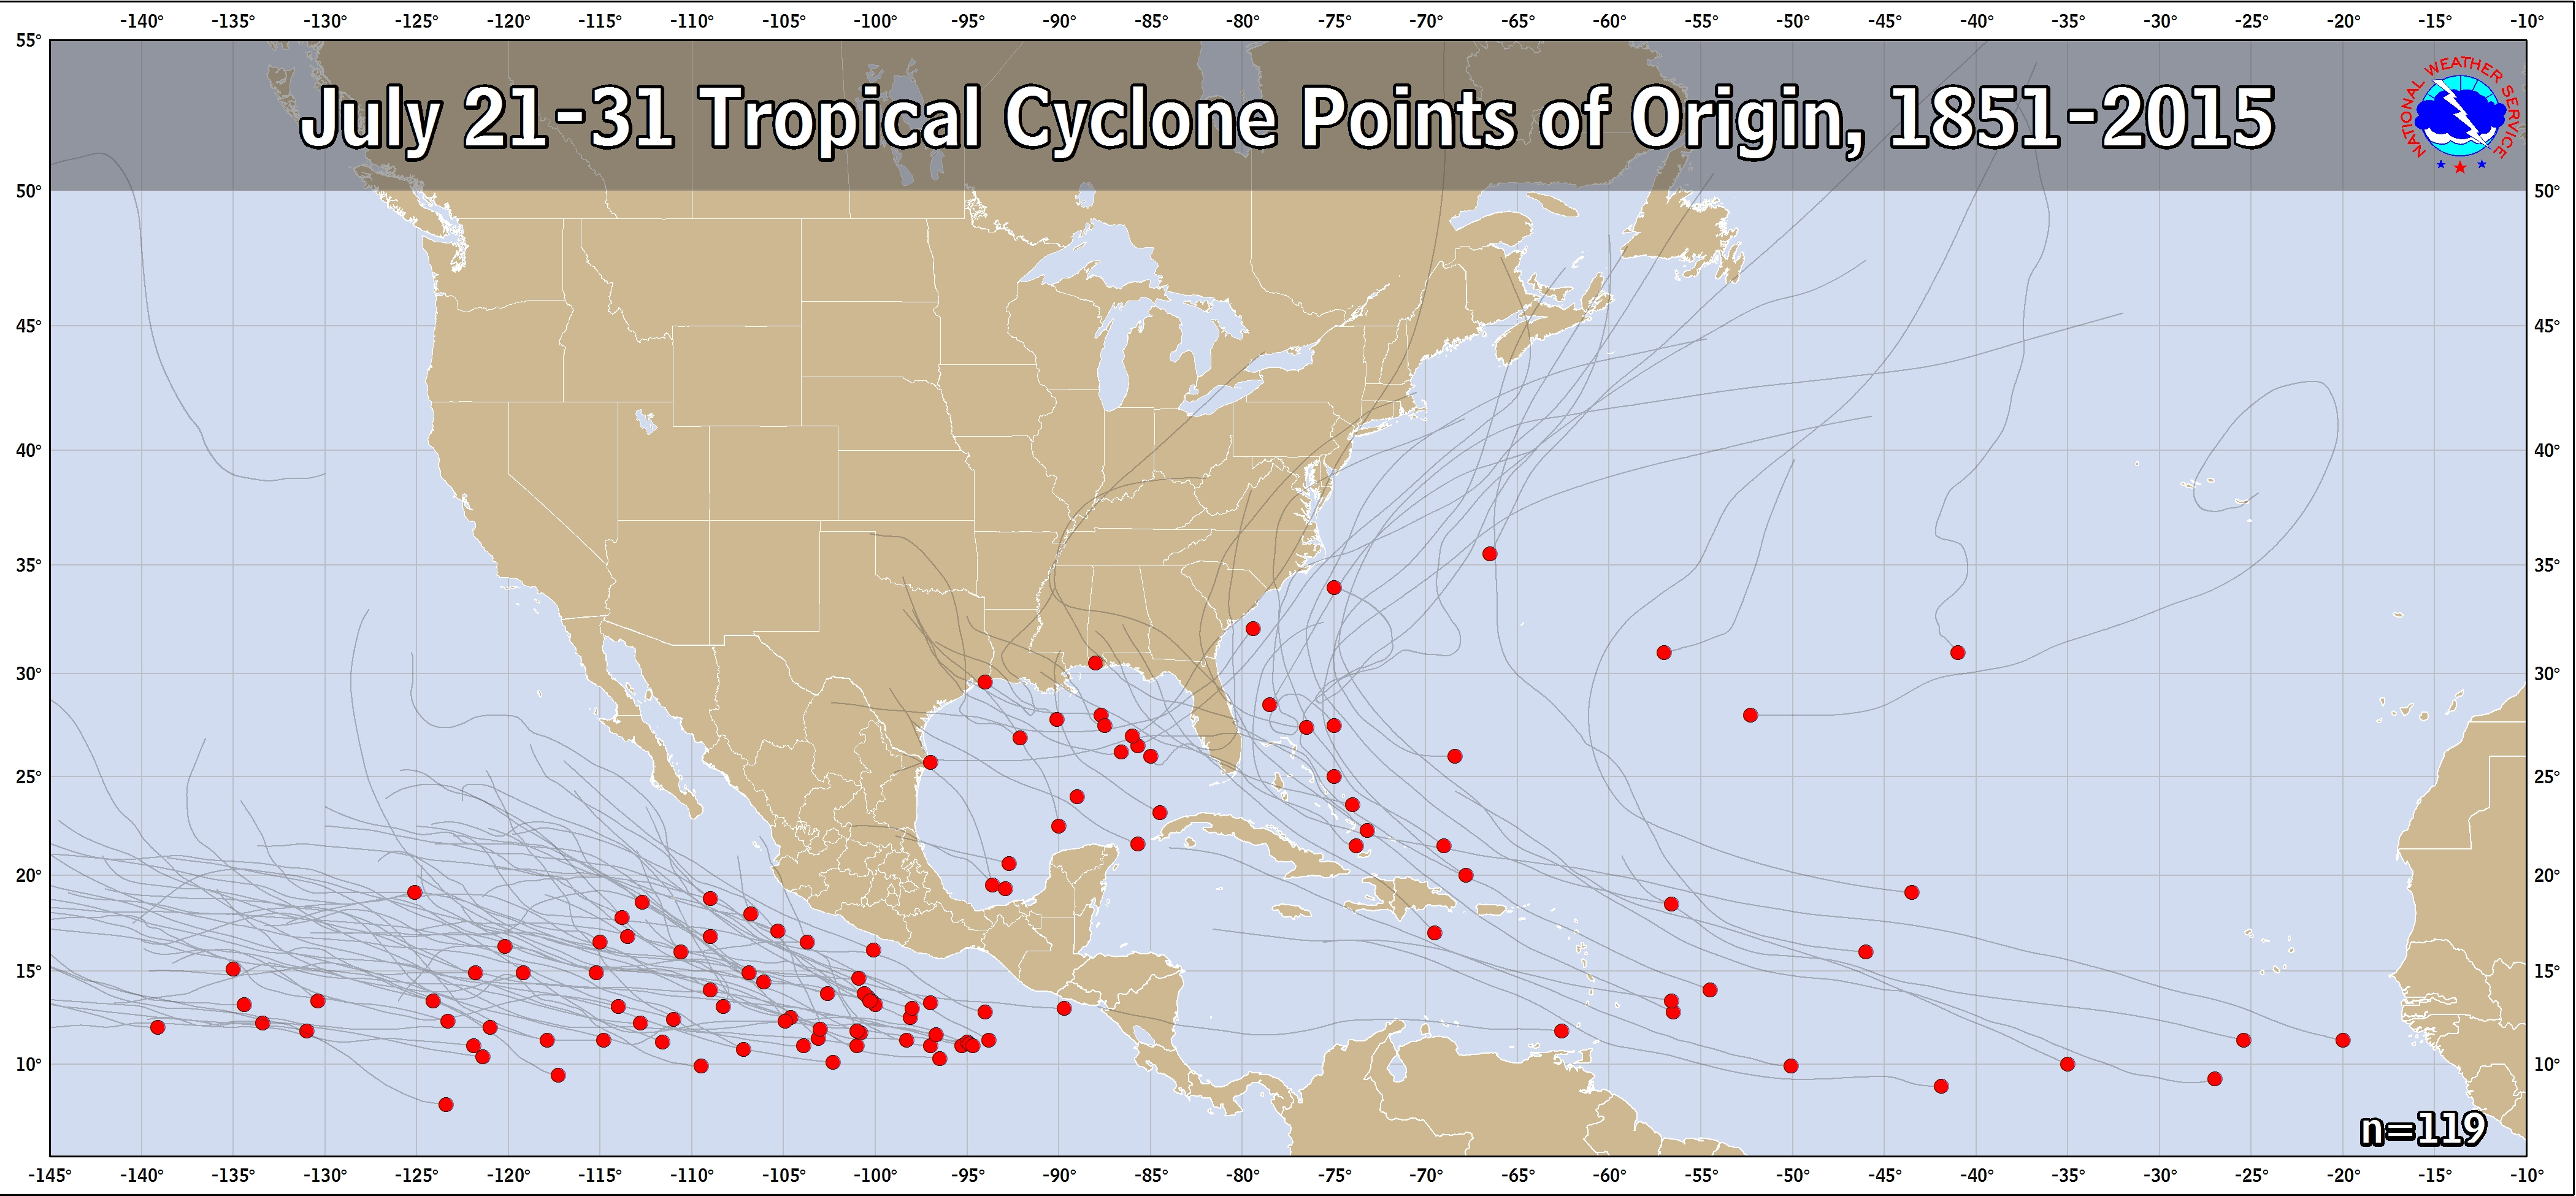
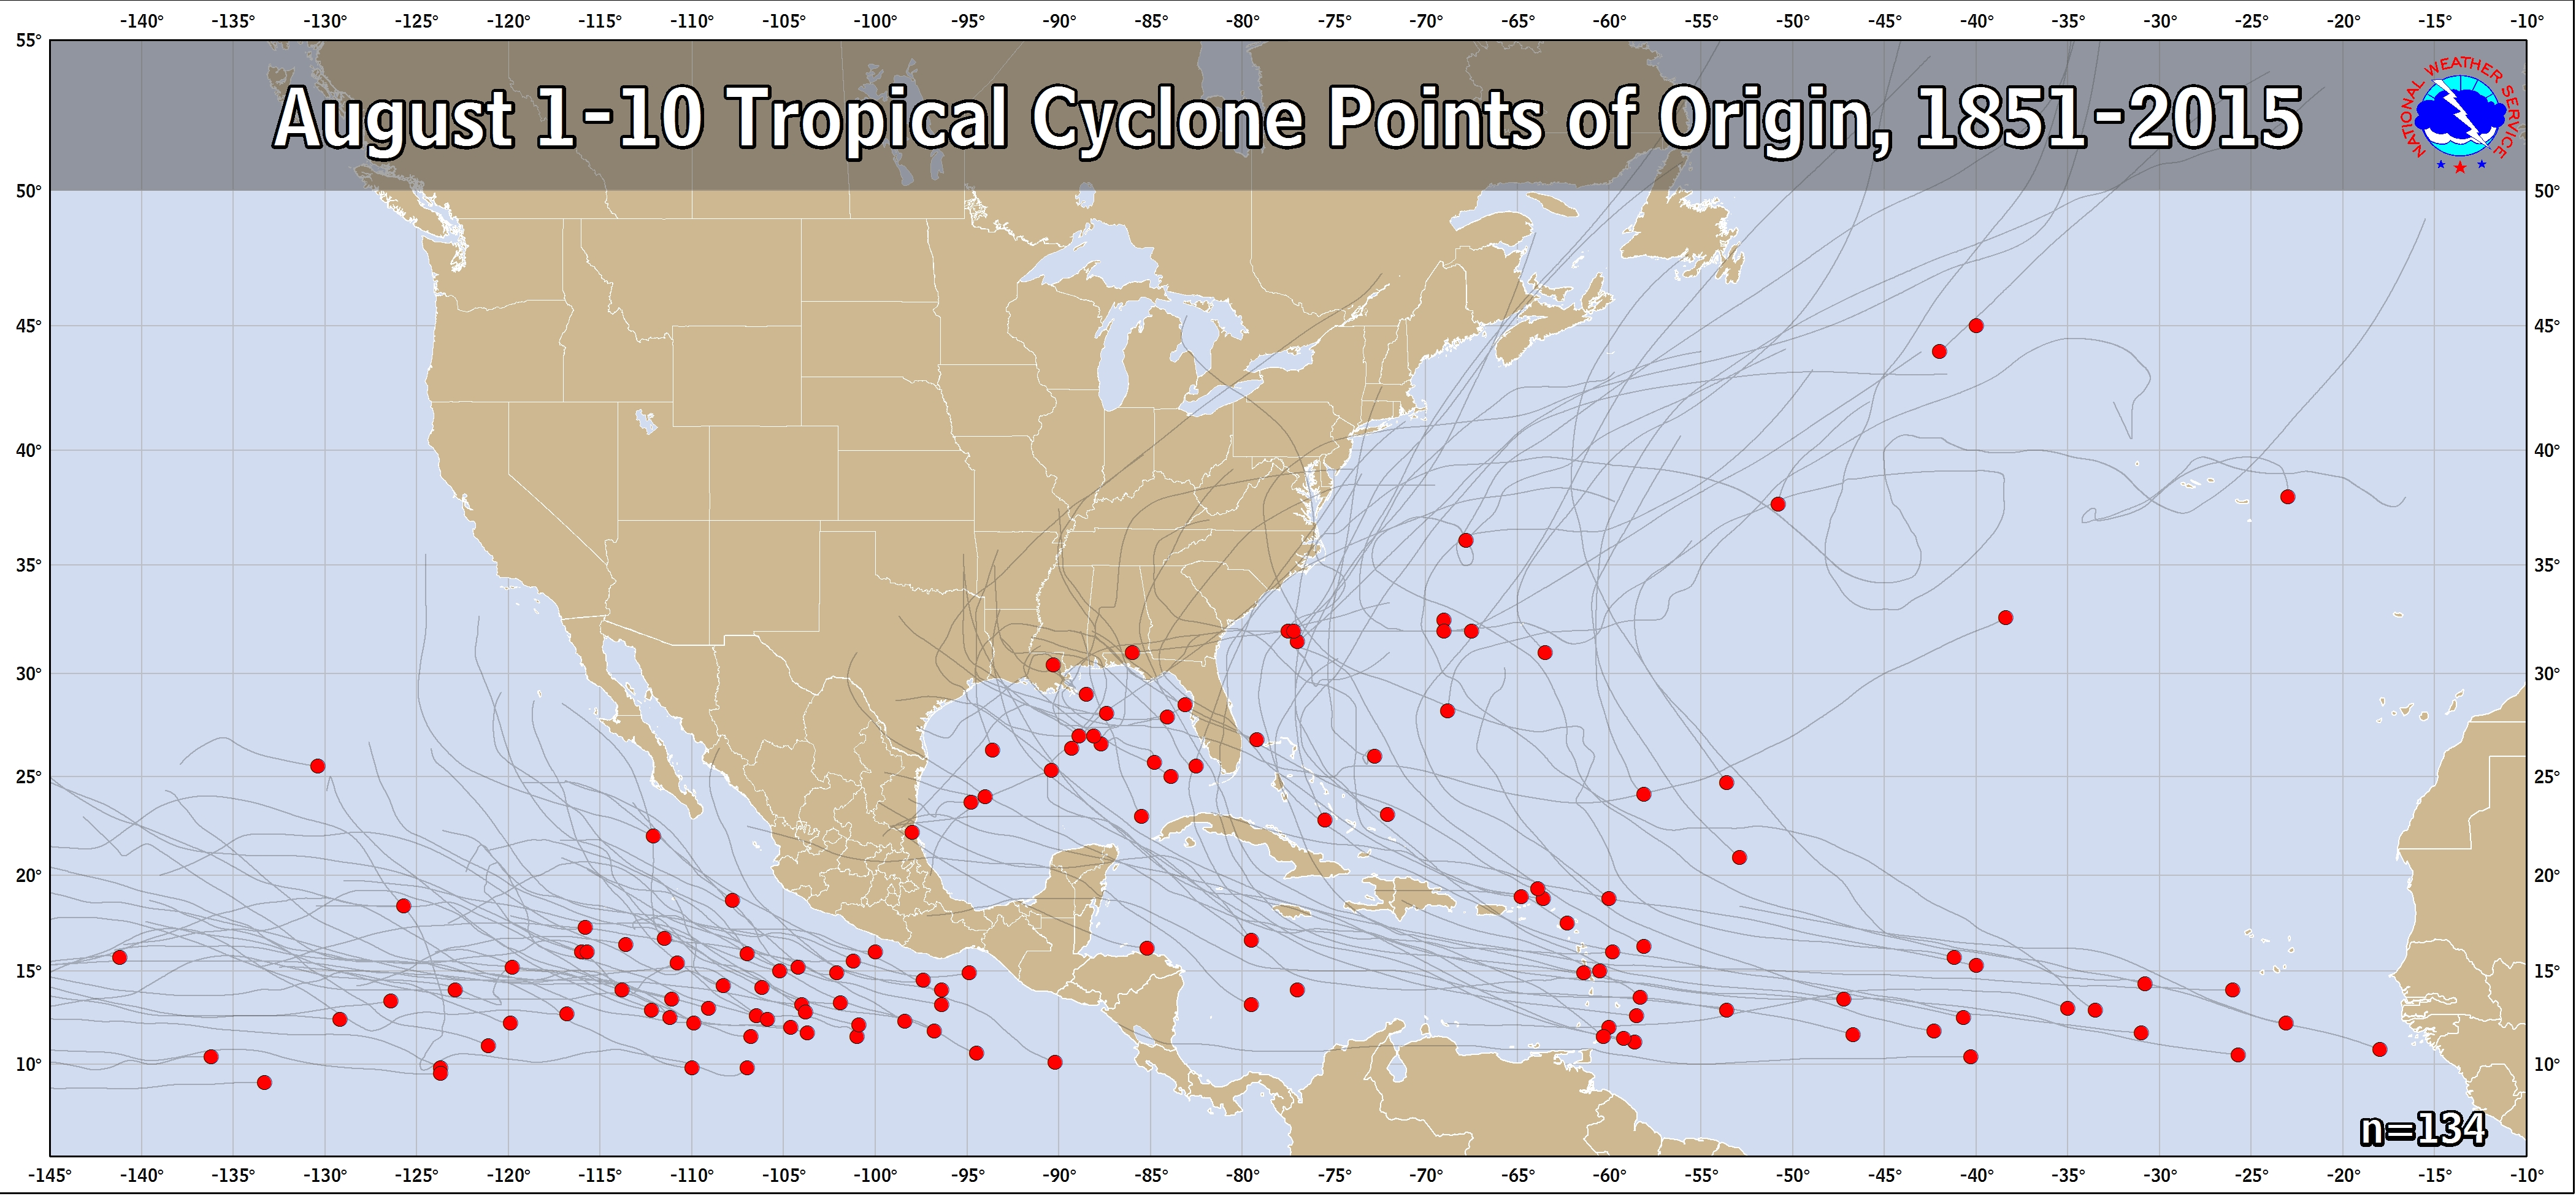
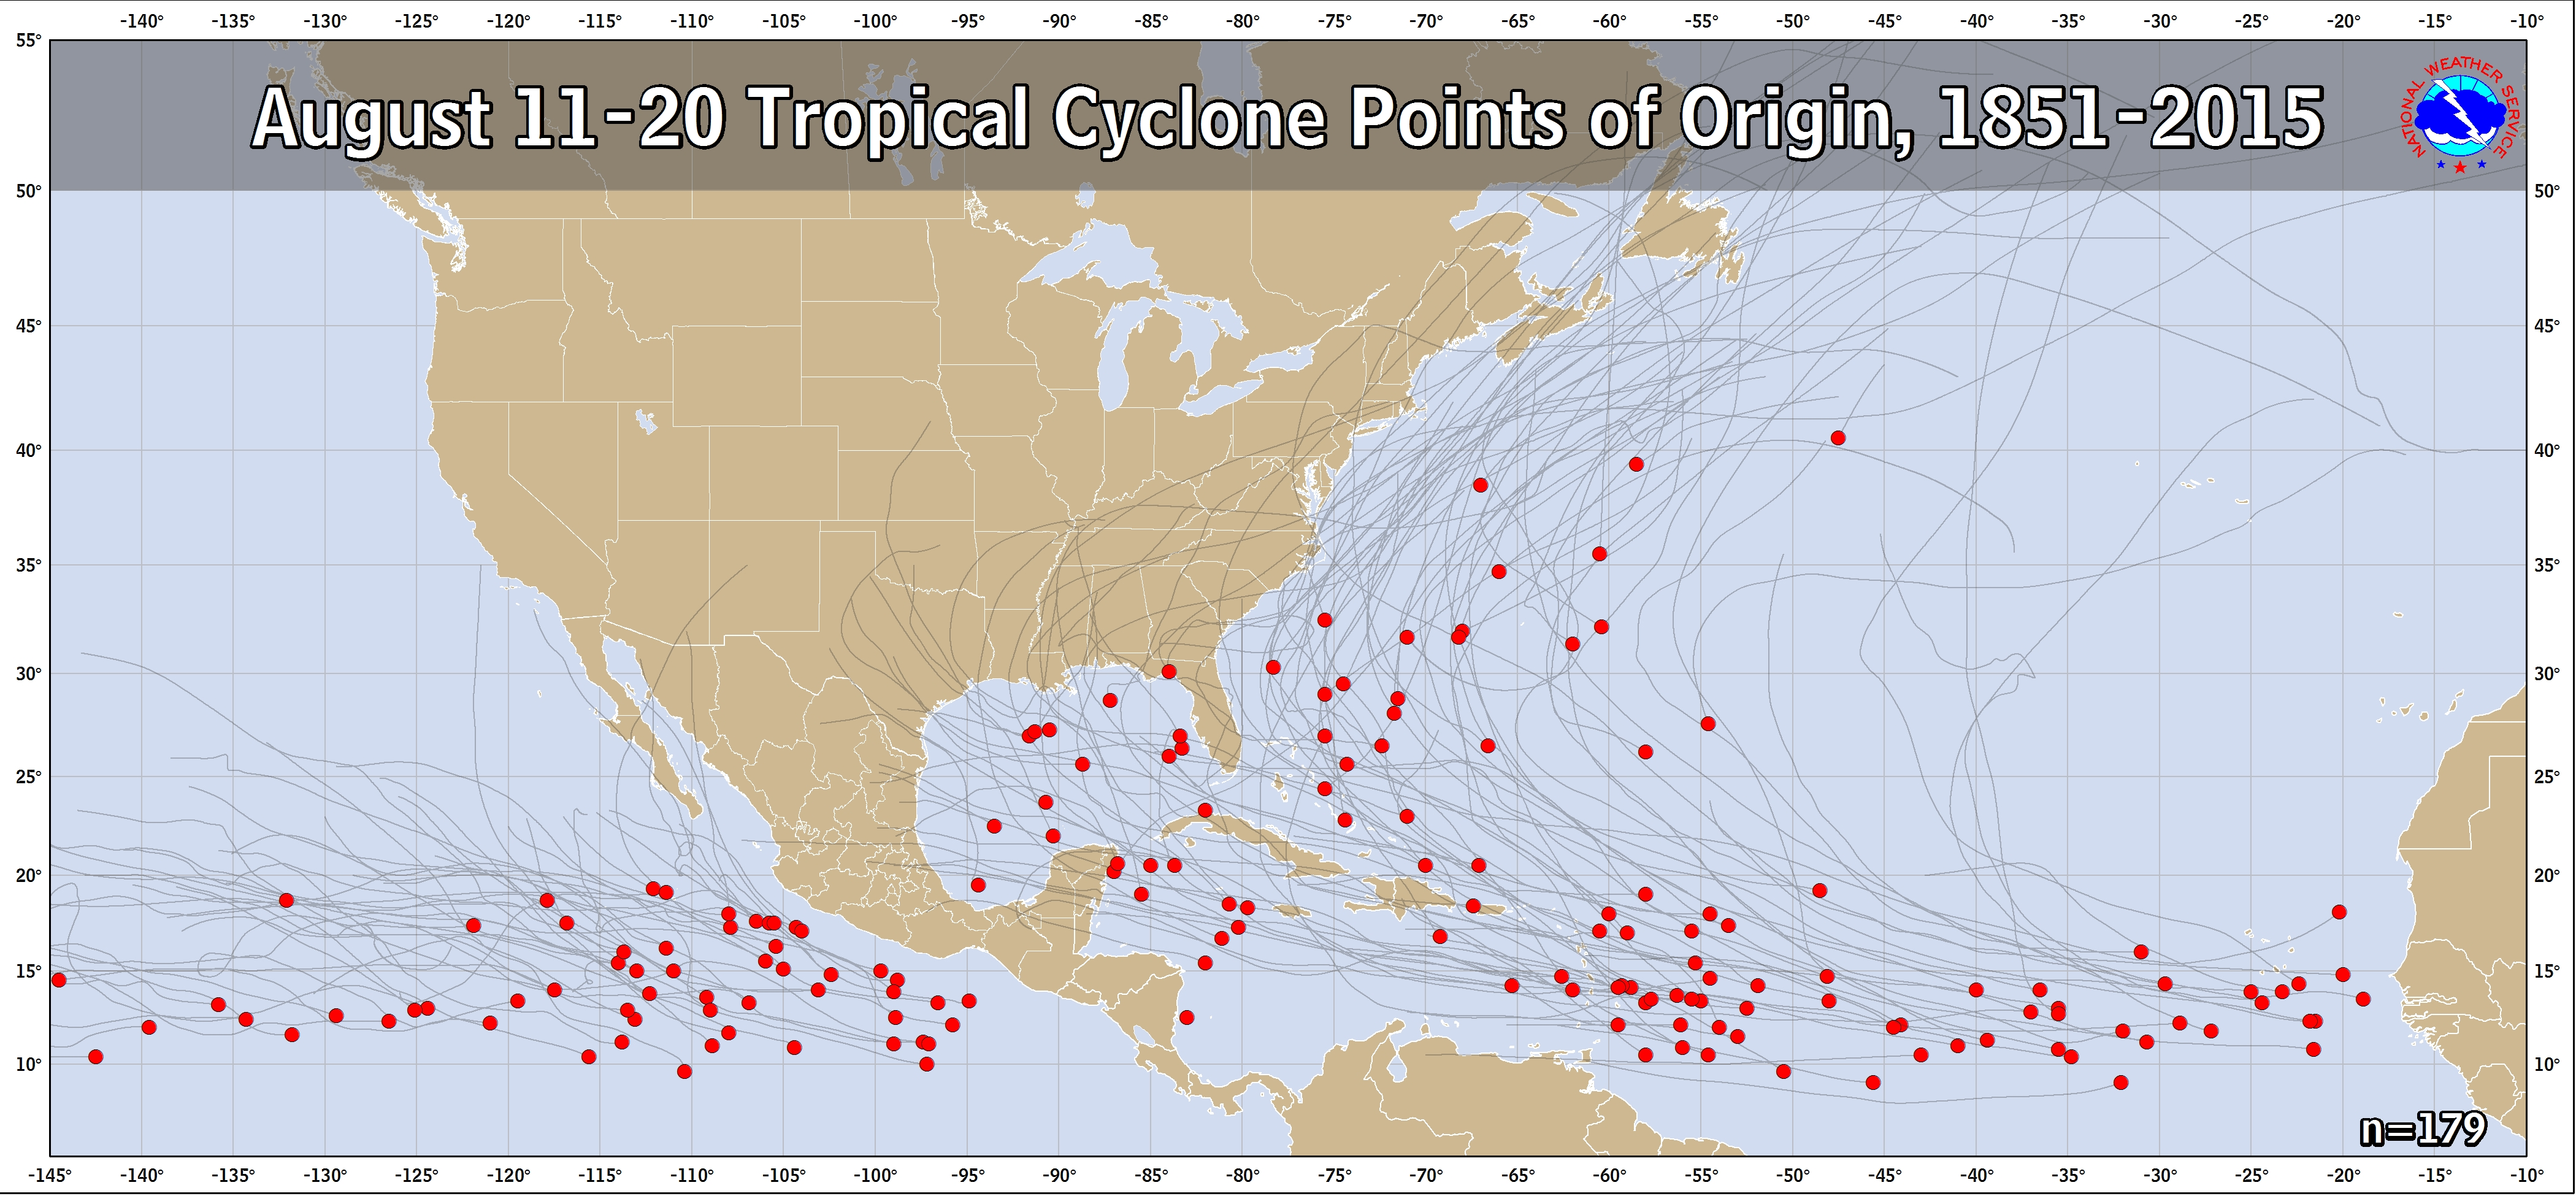
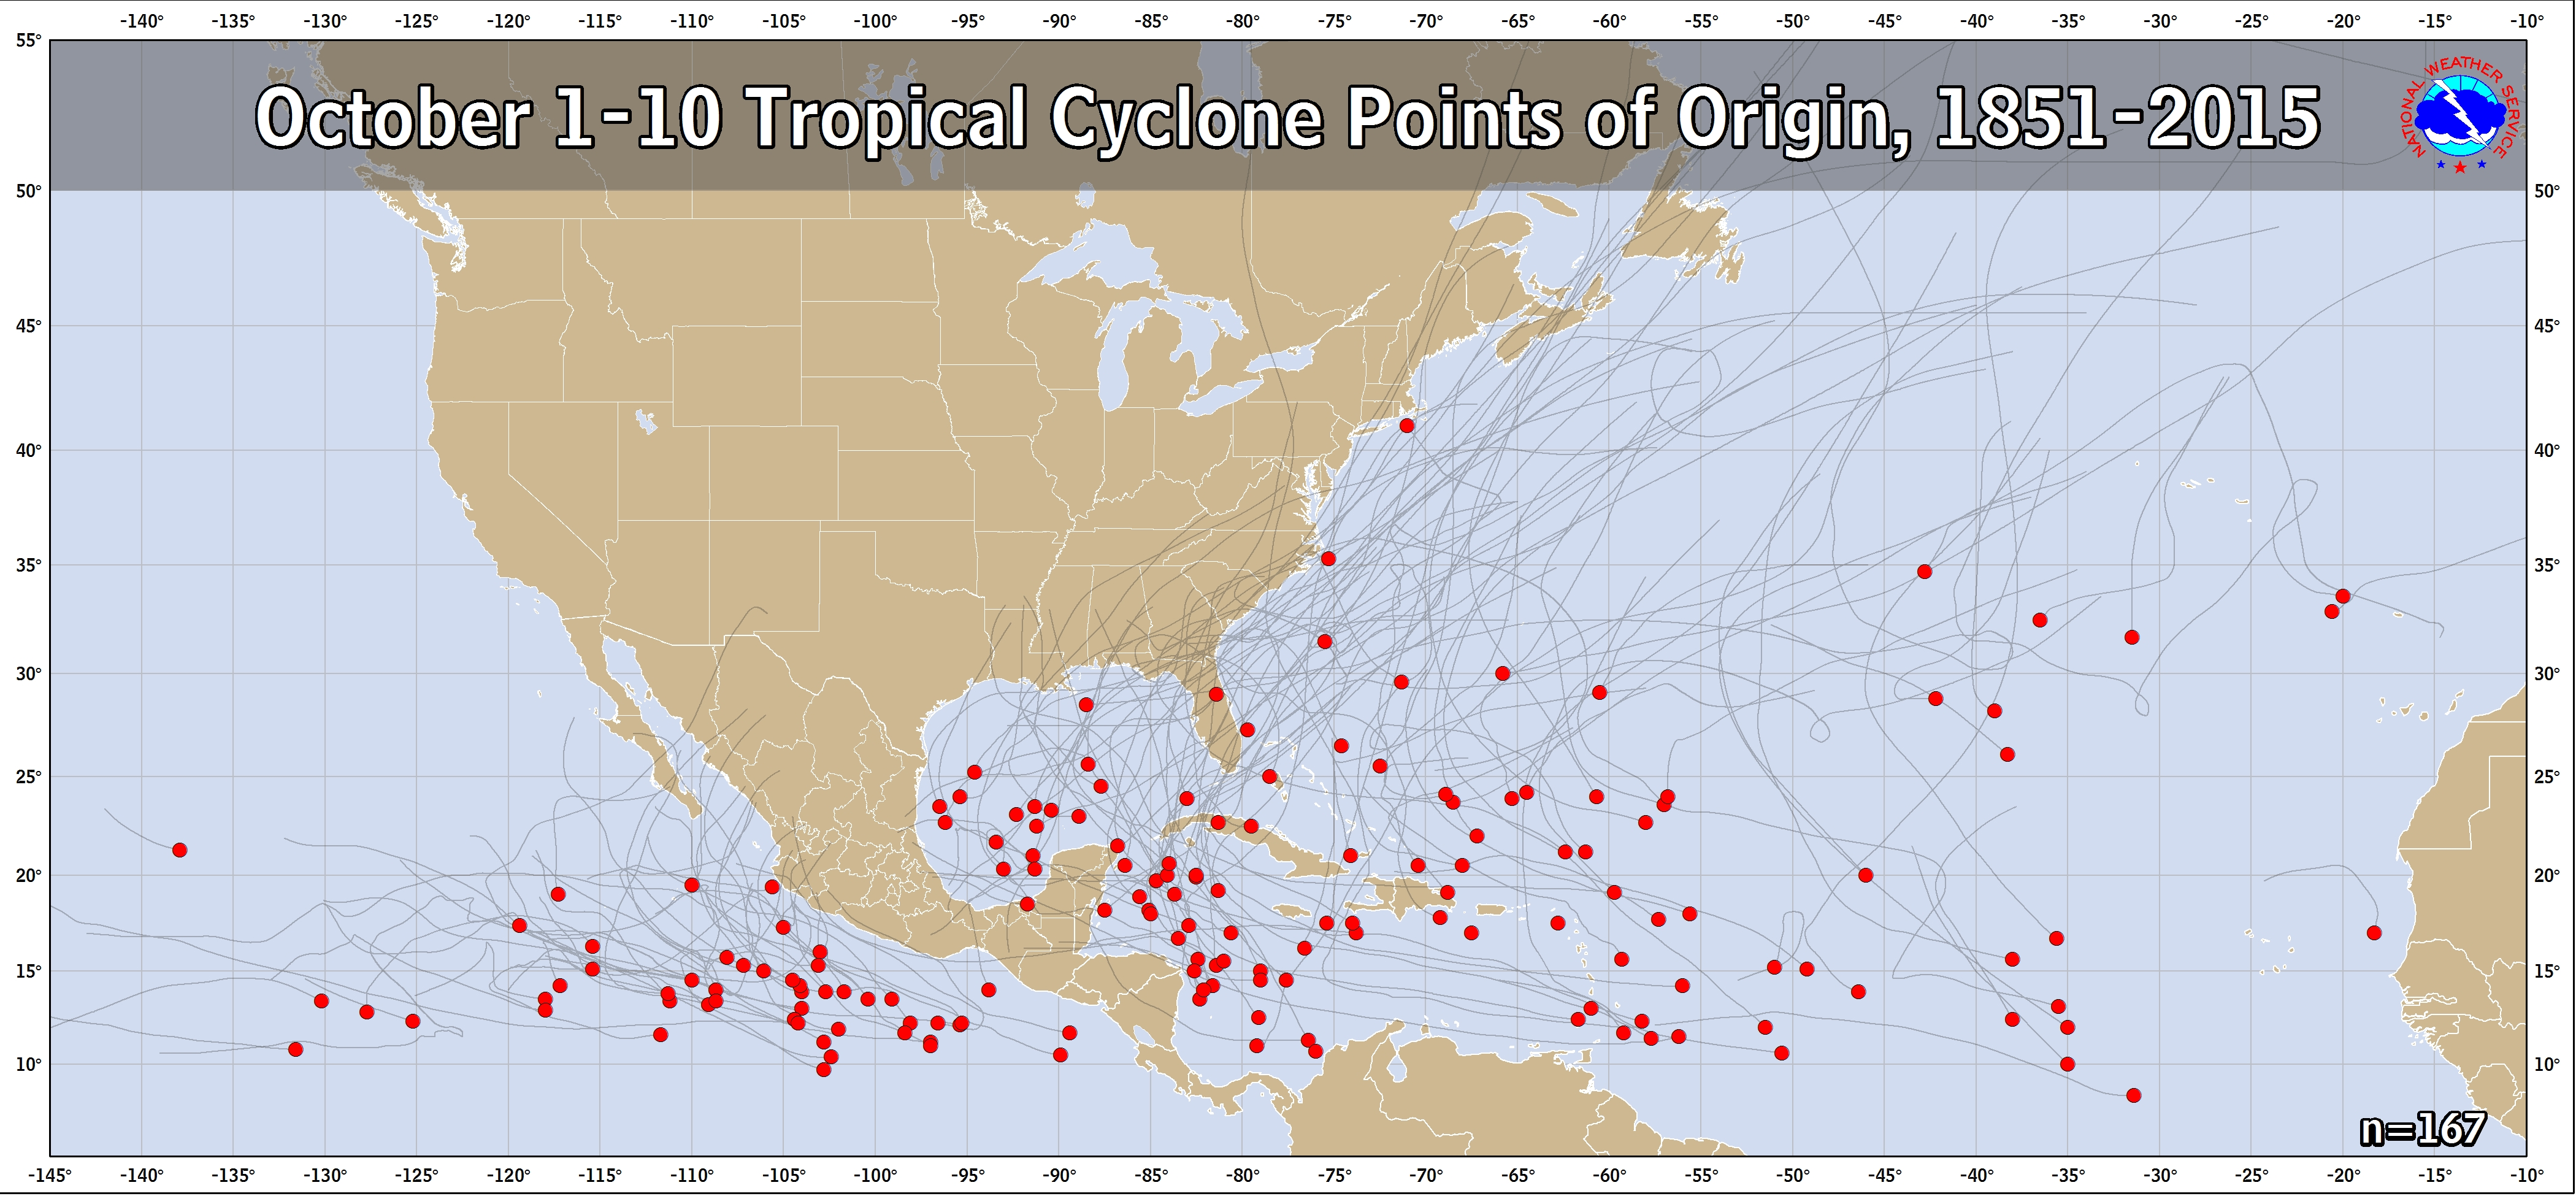
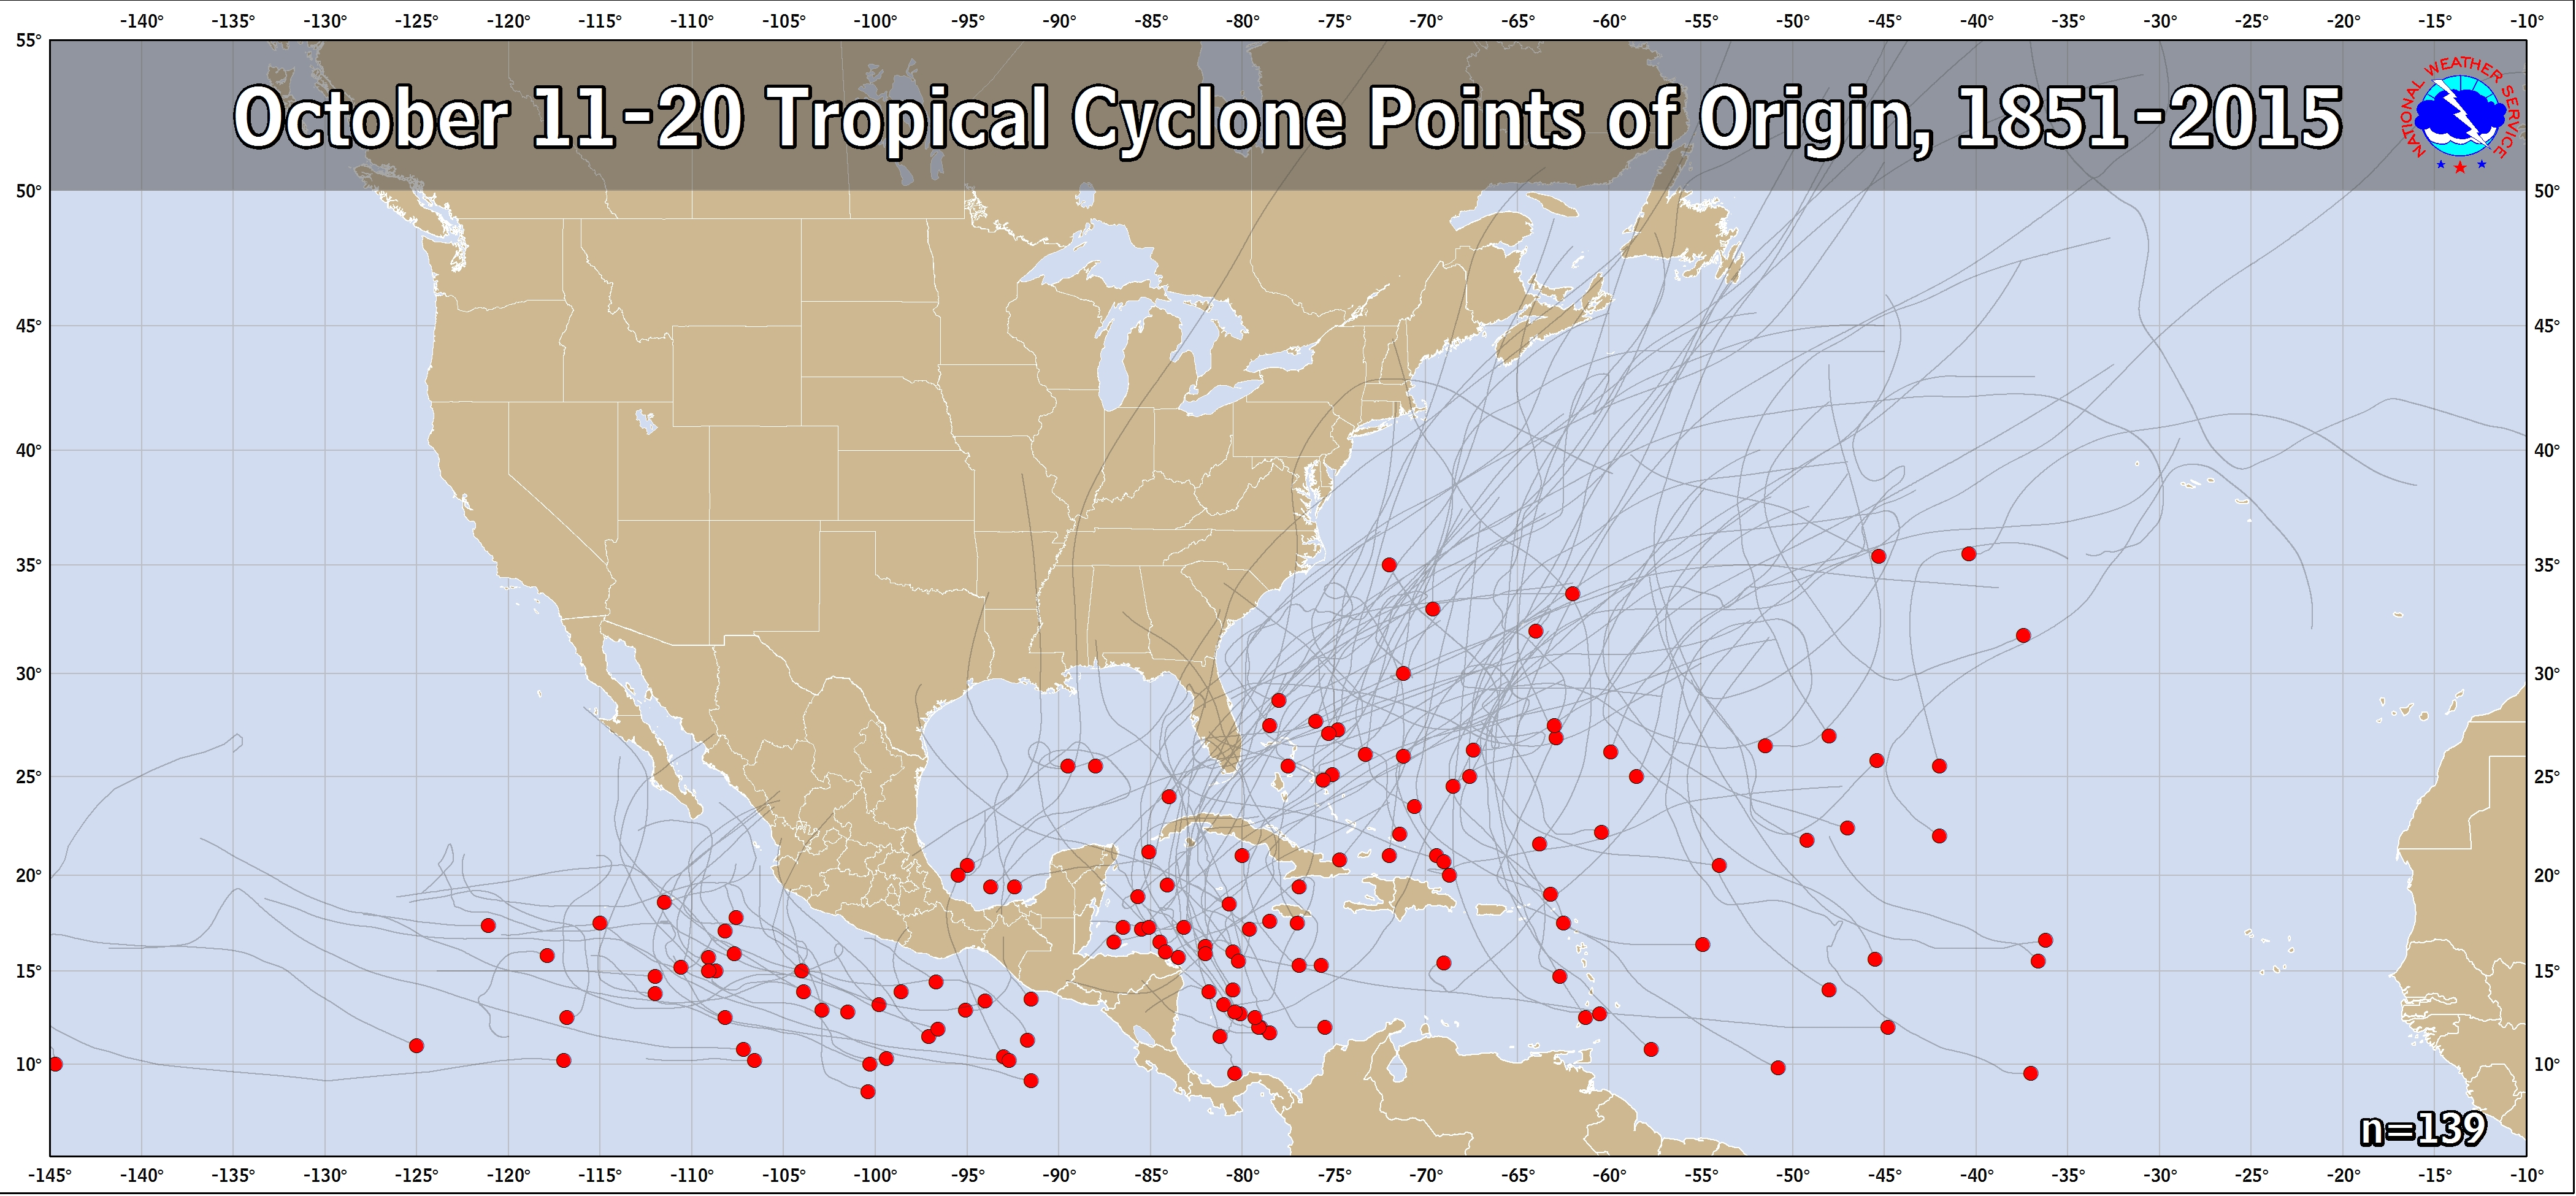
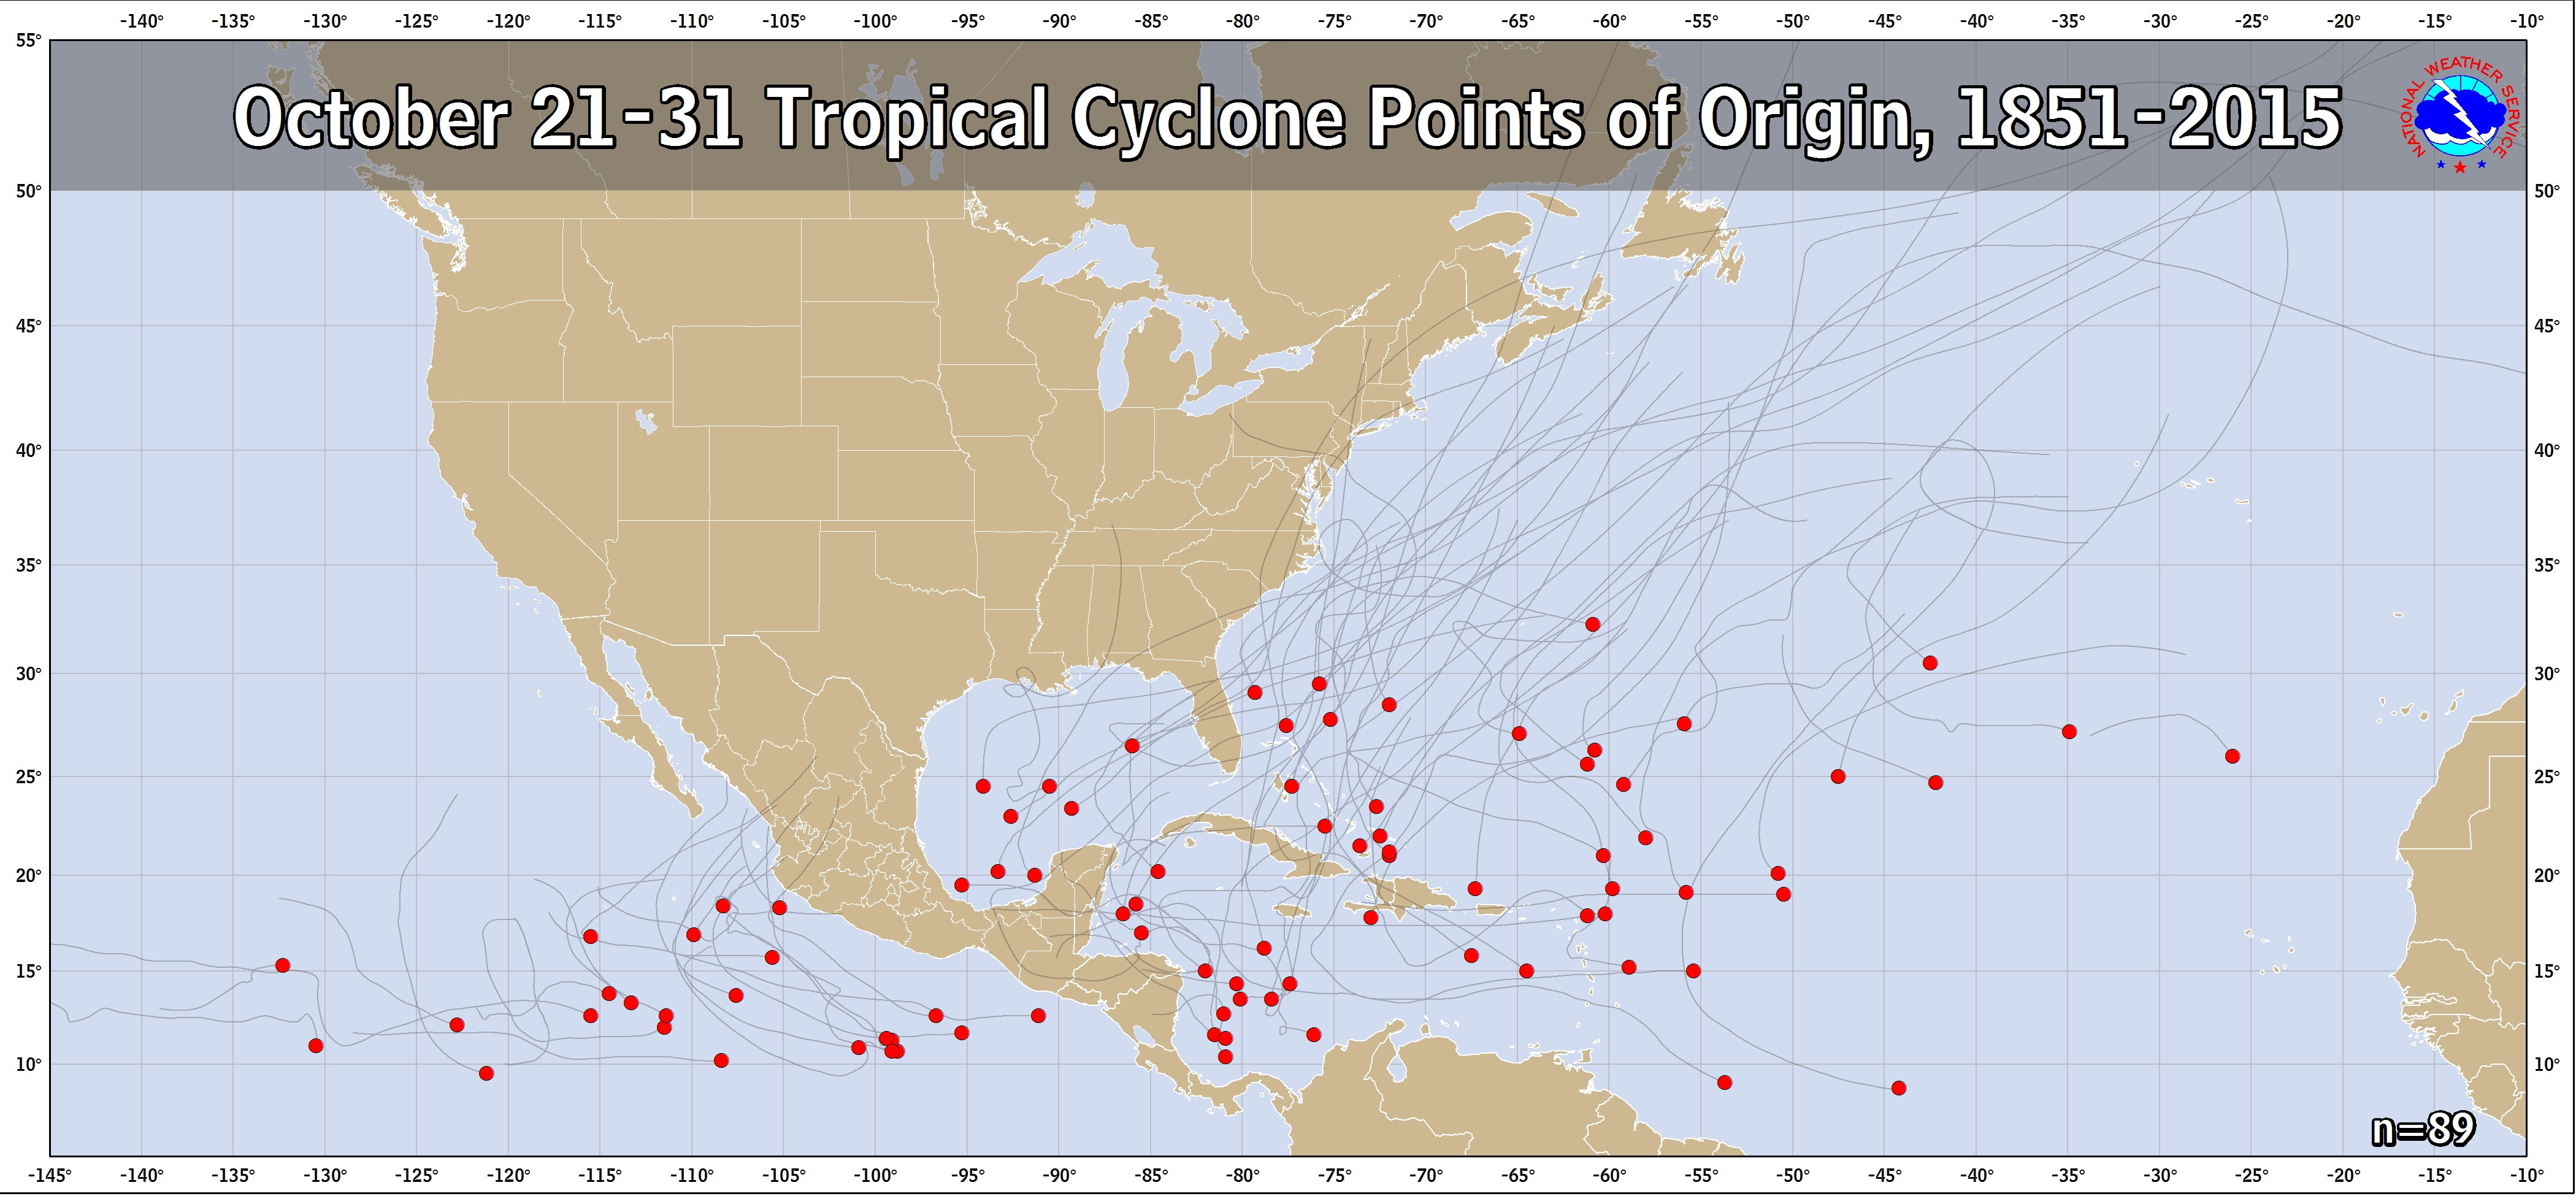
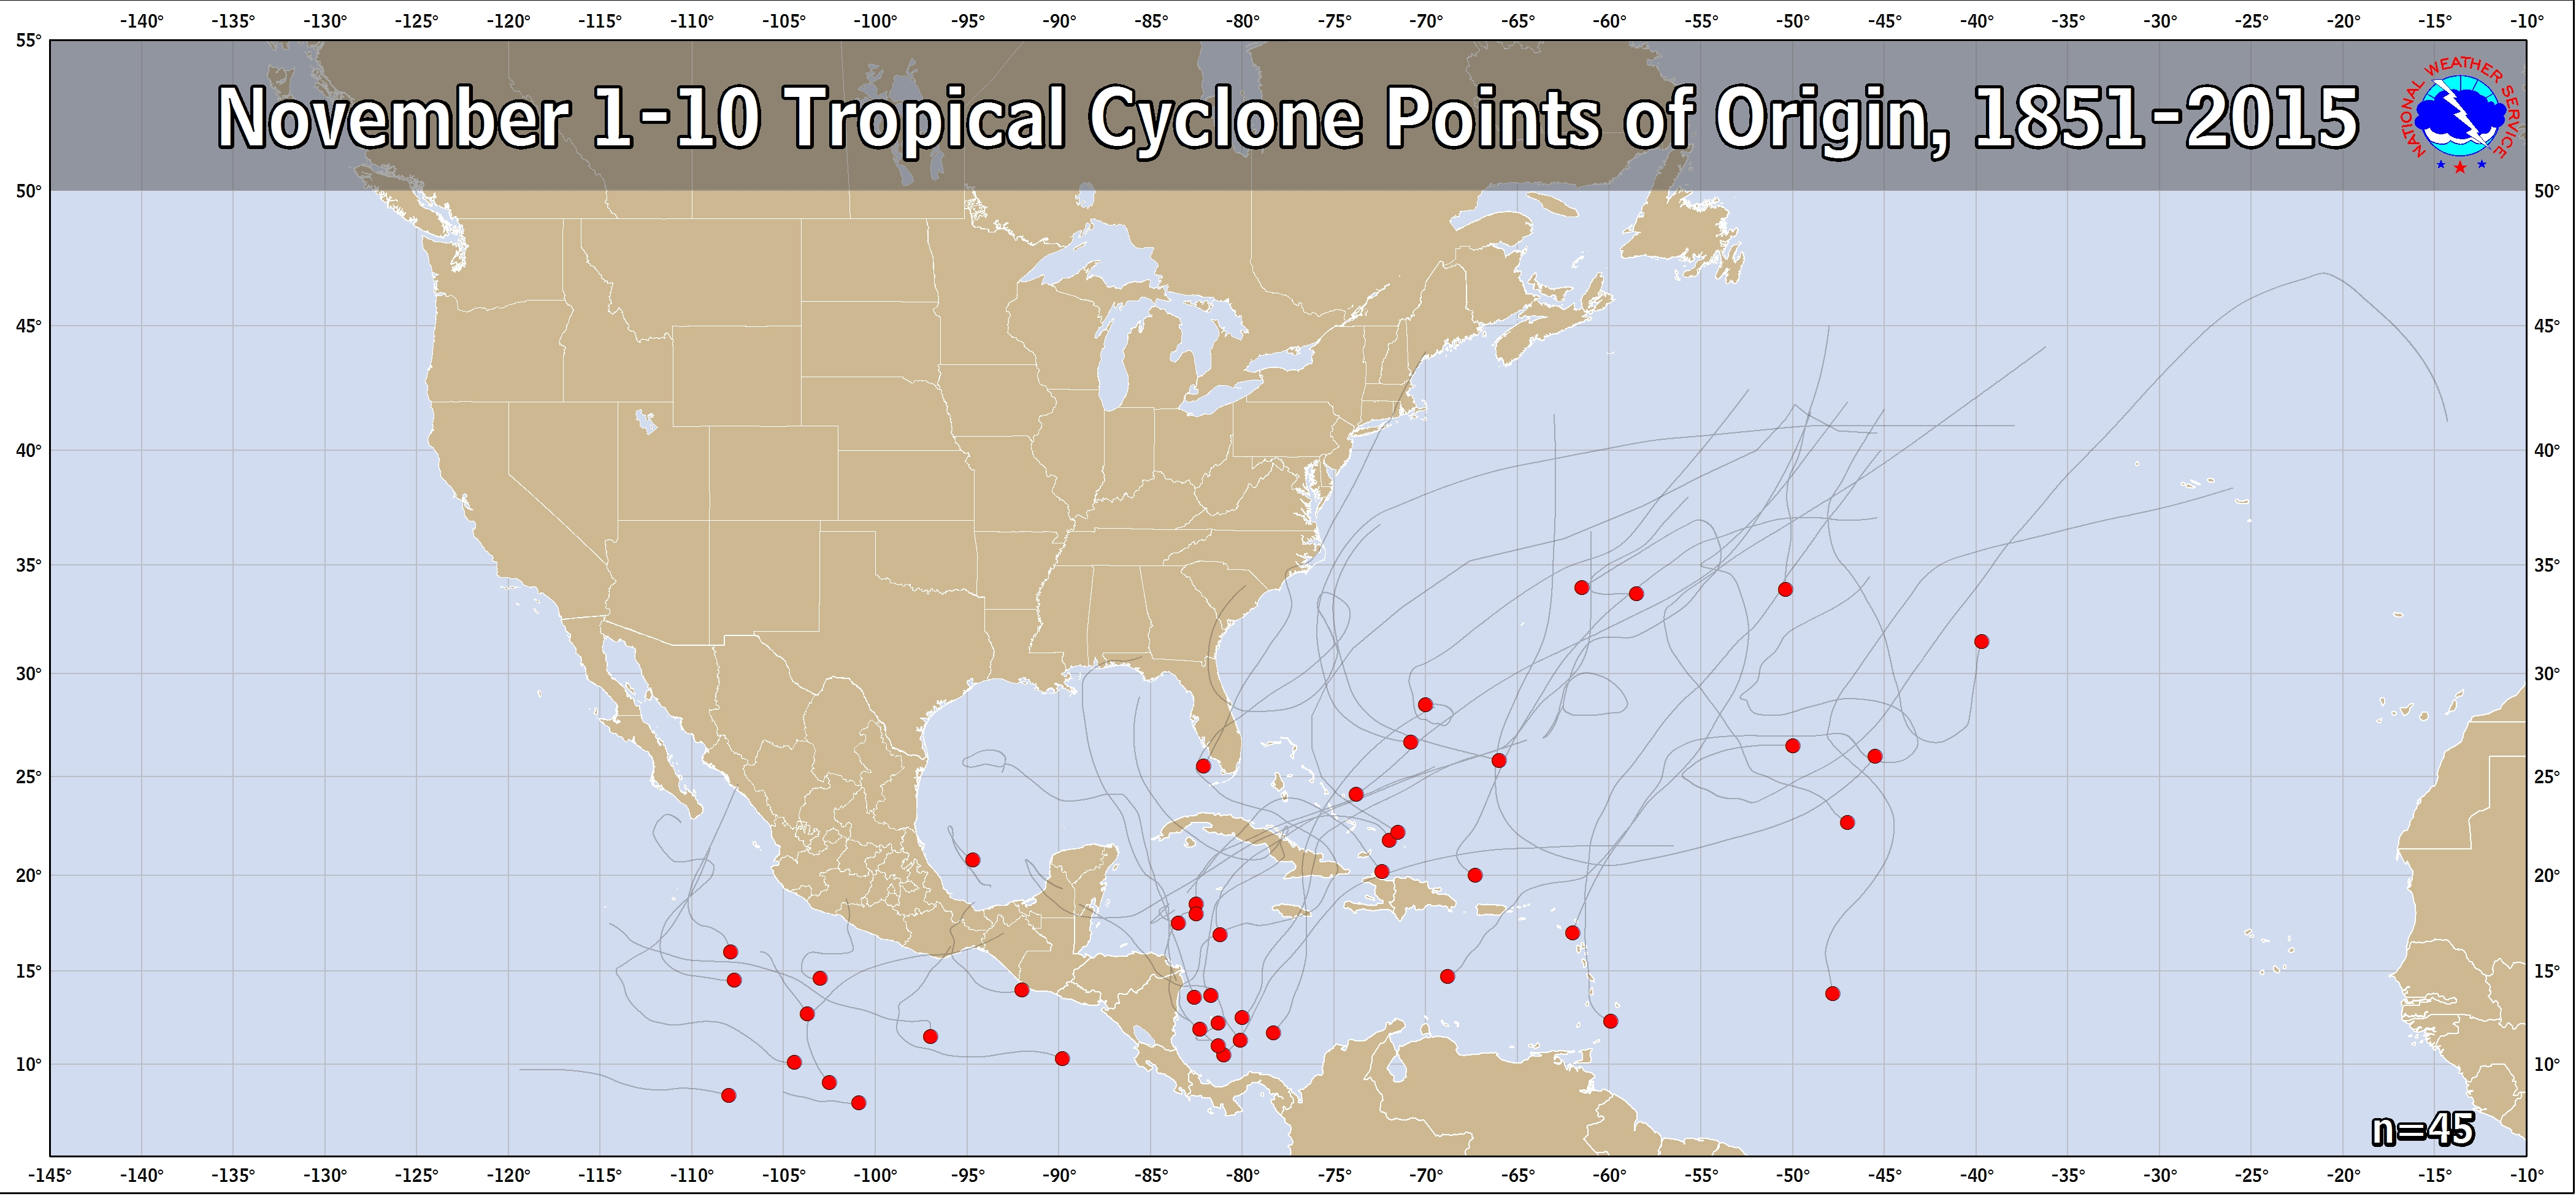
Points of Origin by 10-Day Period
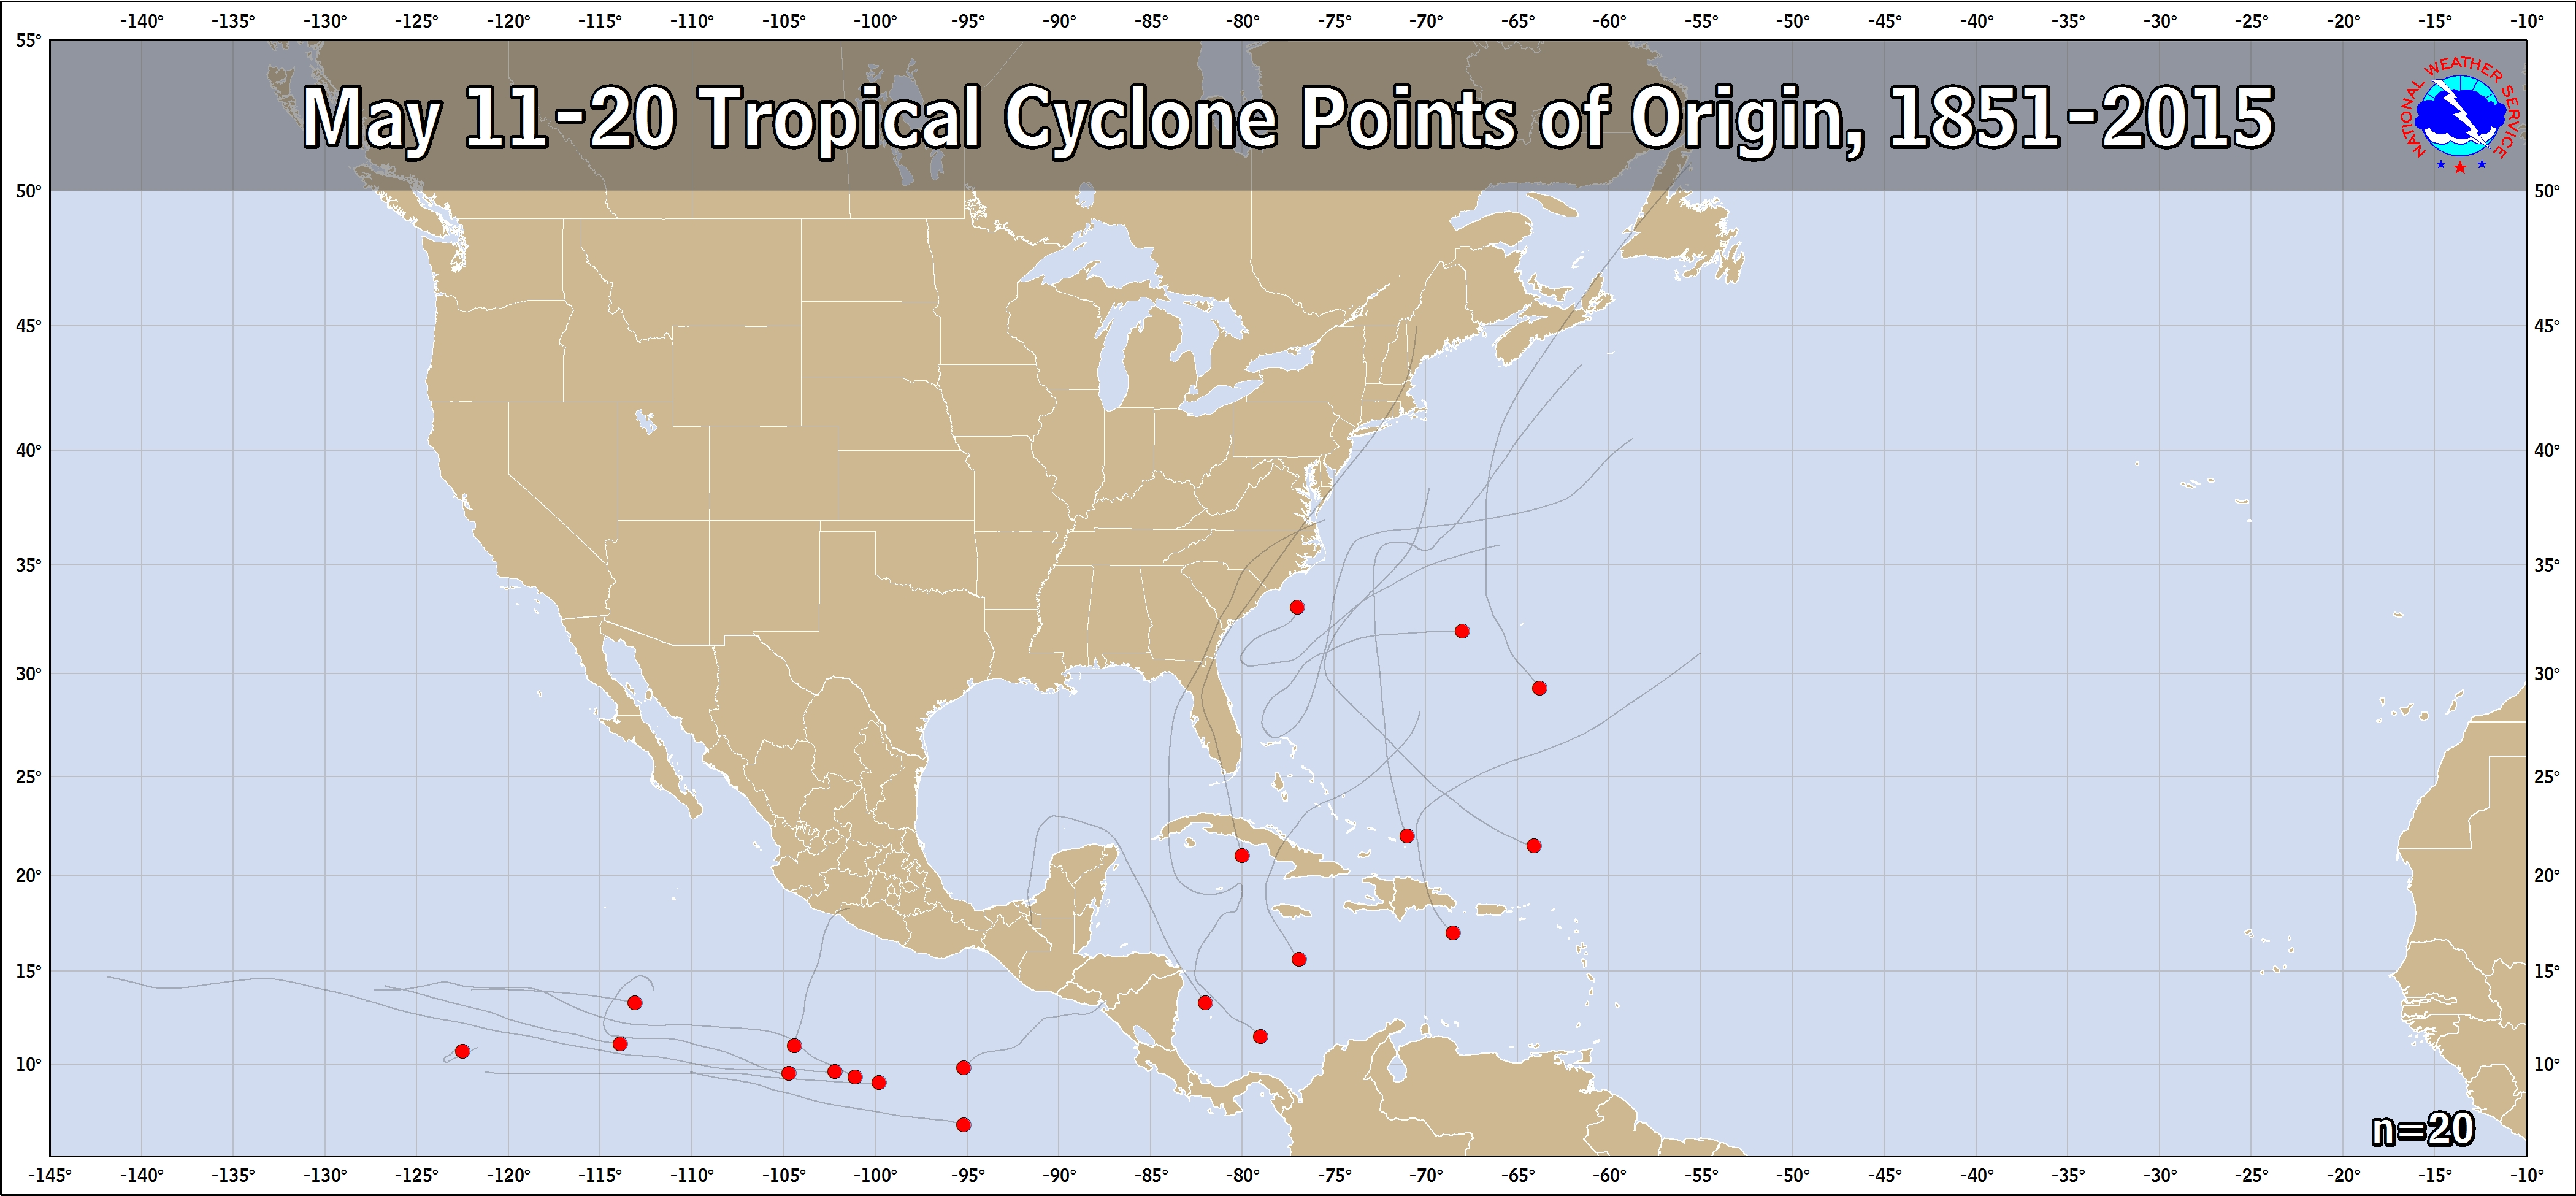
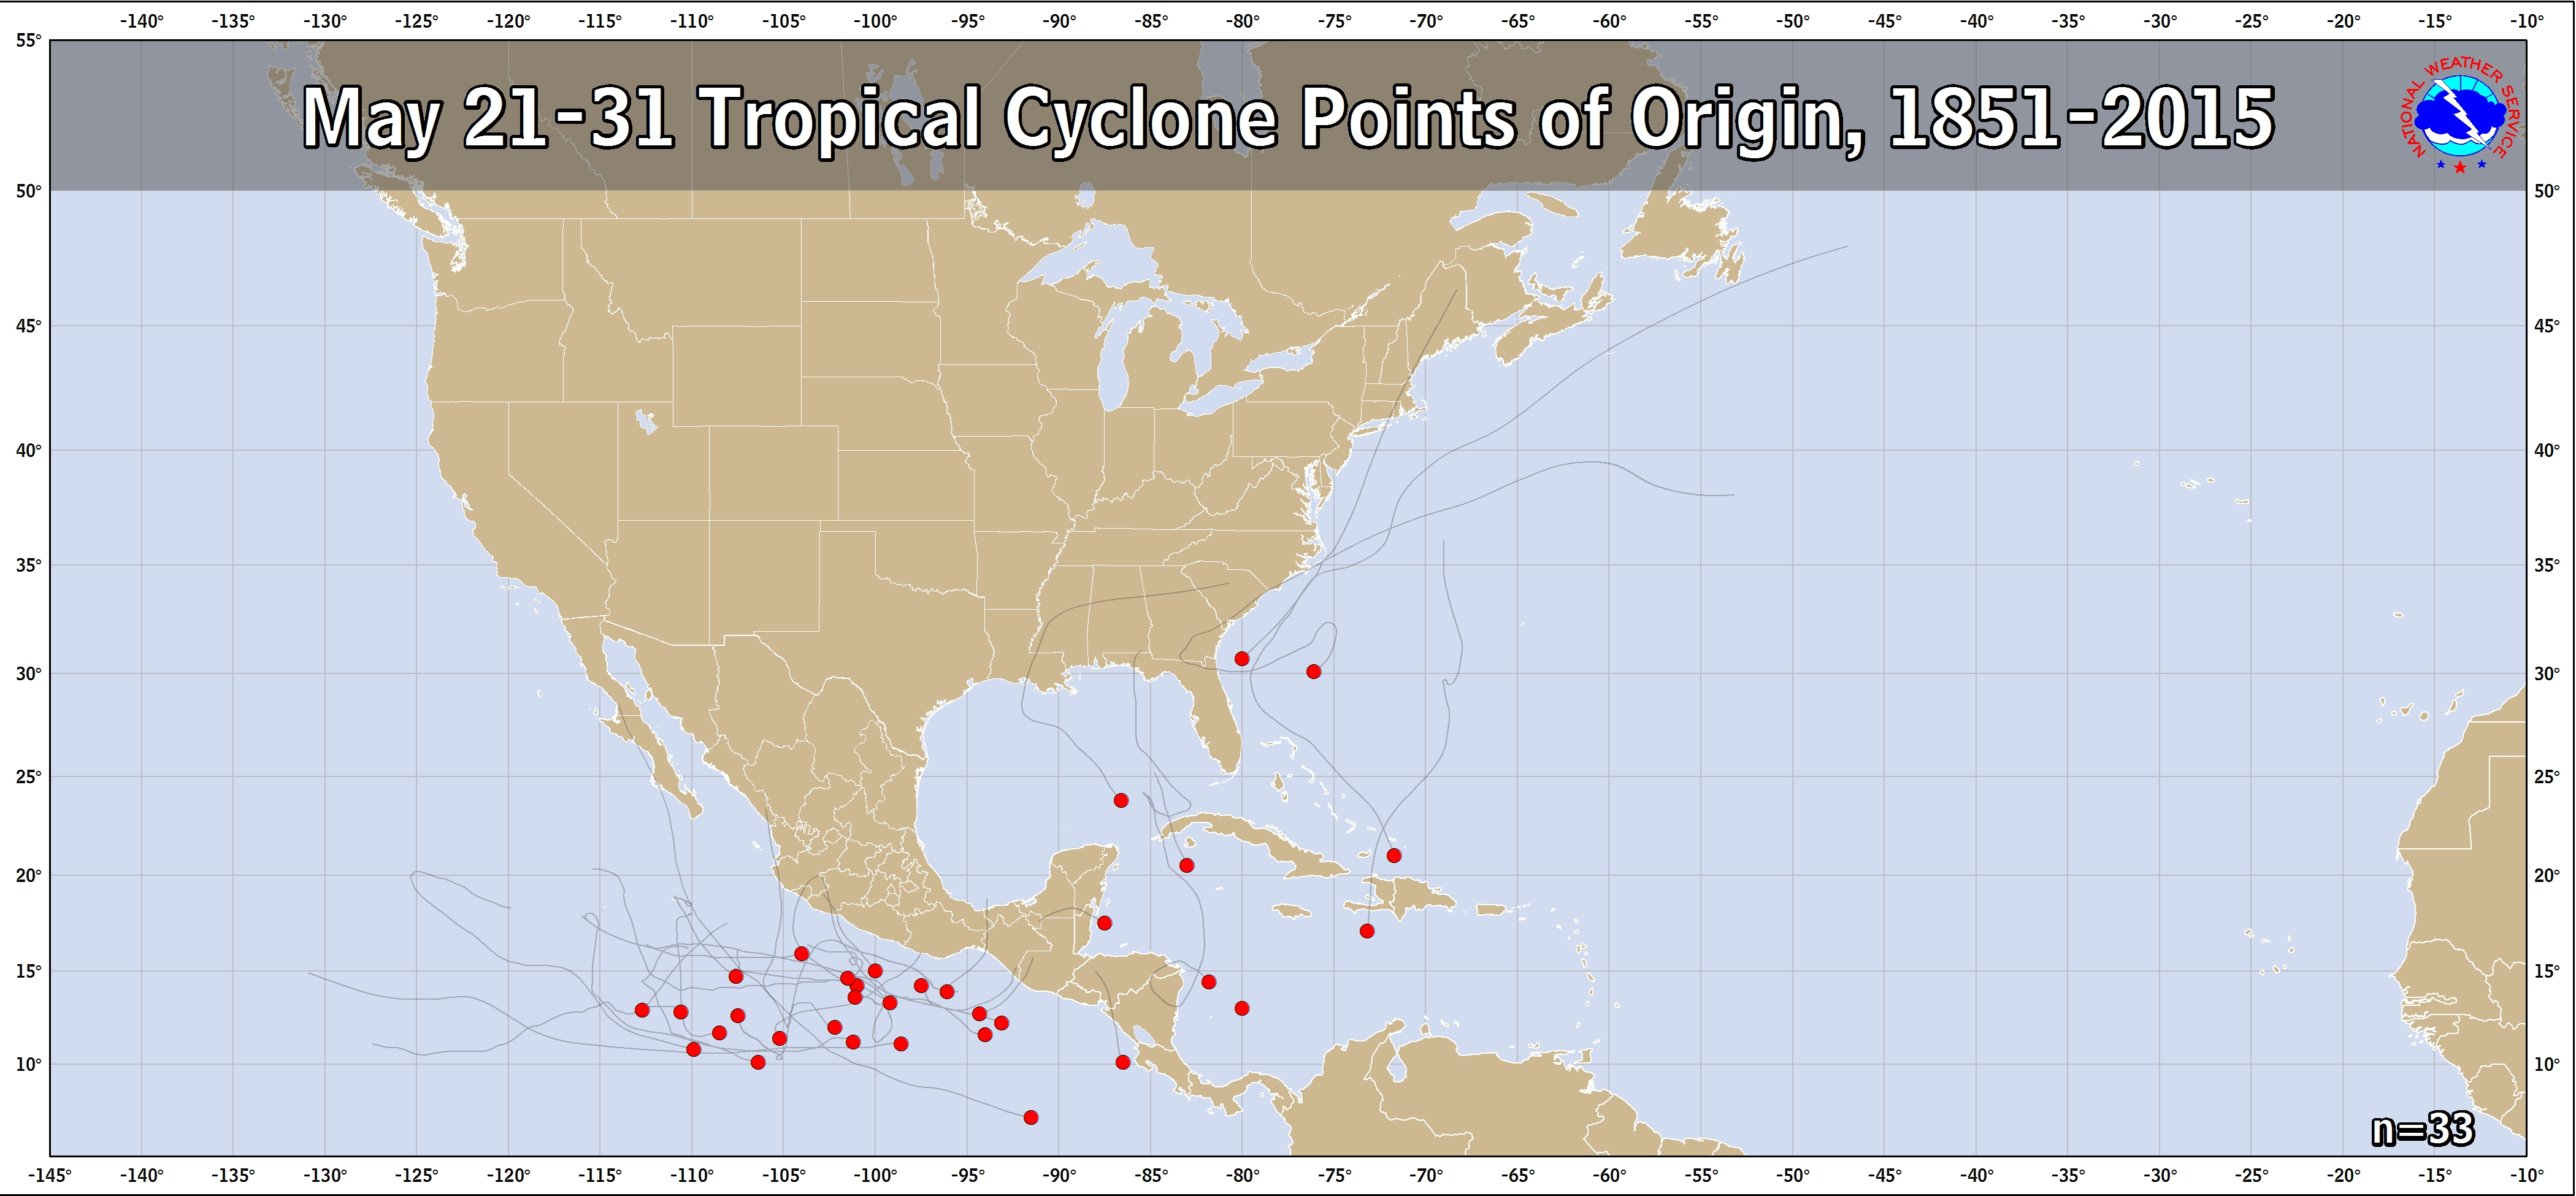
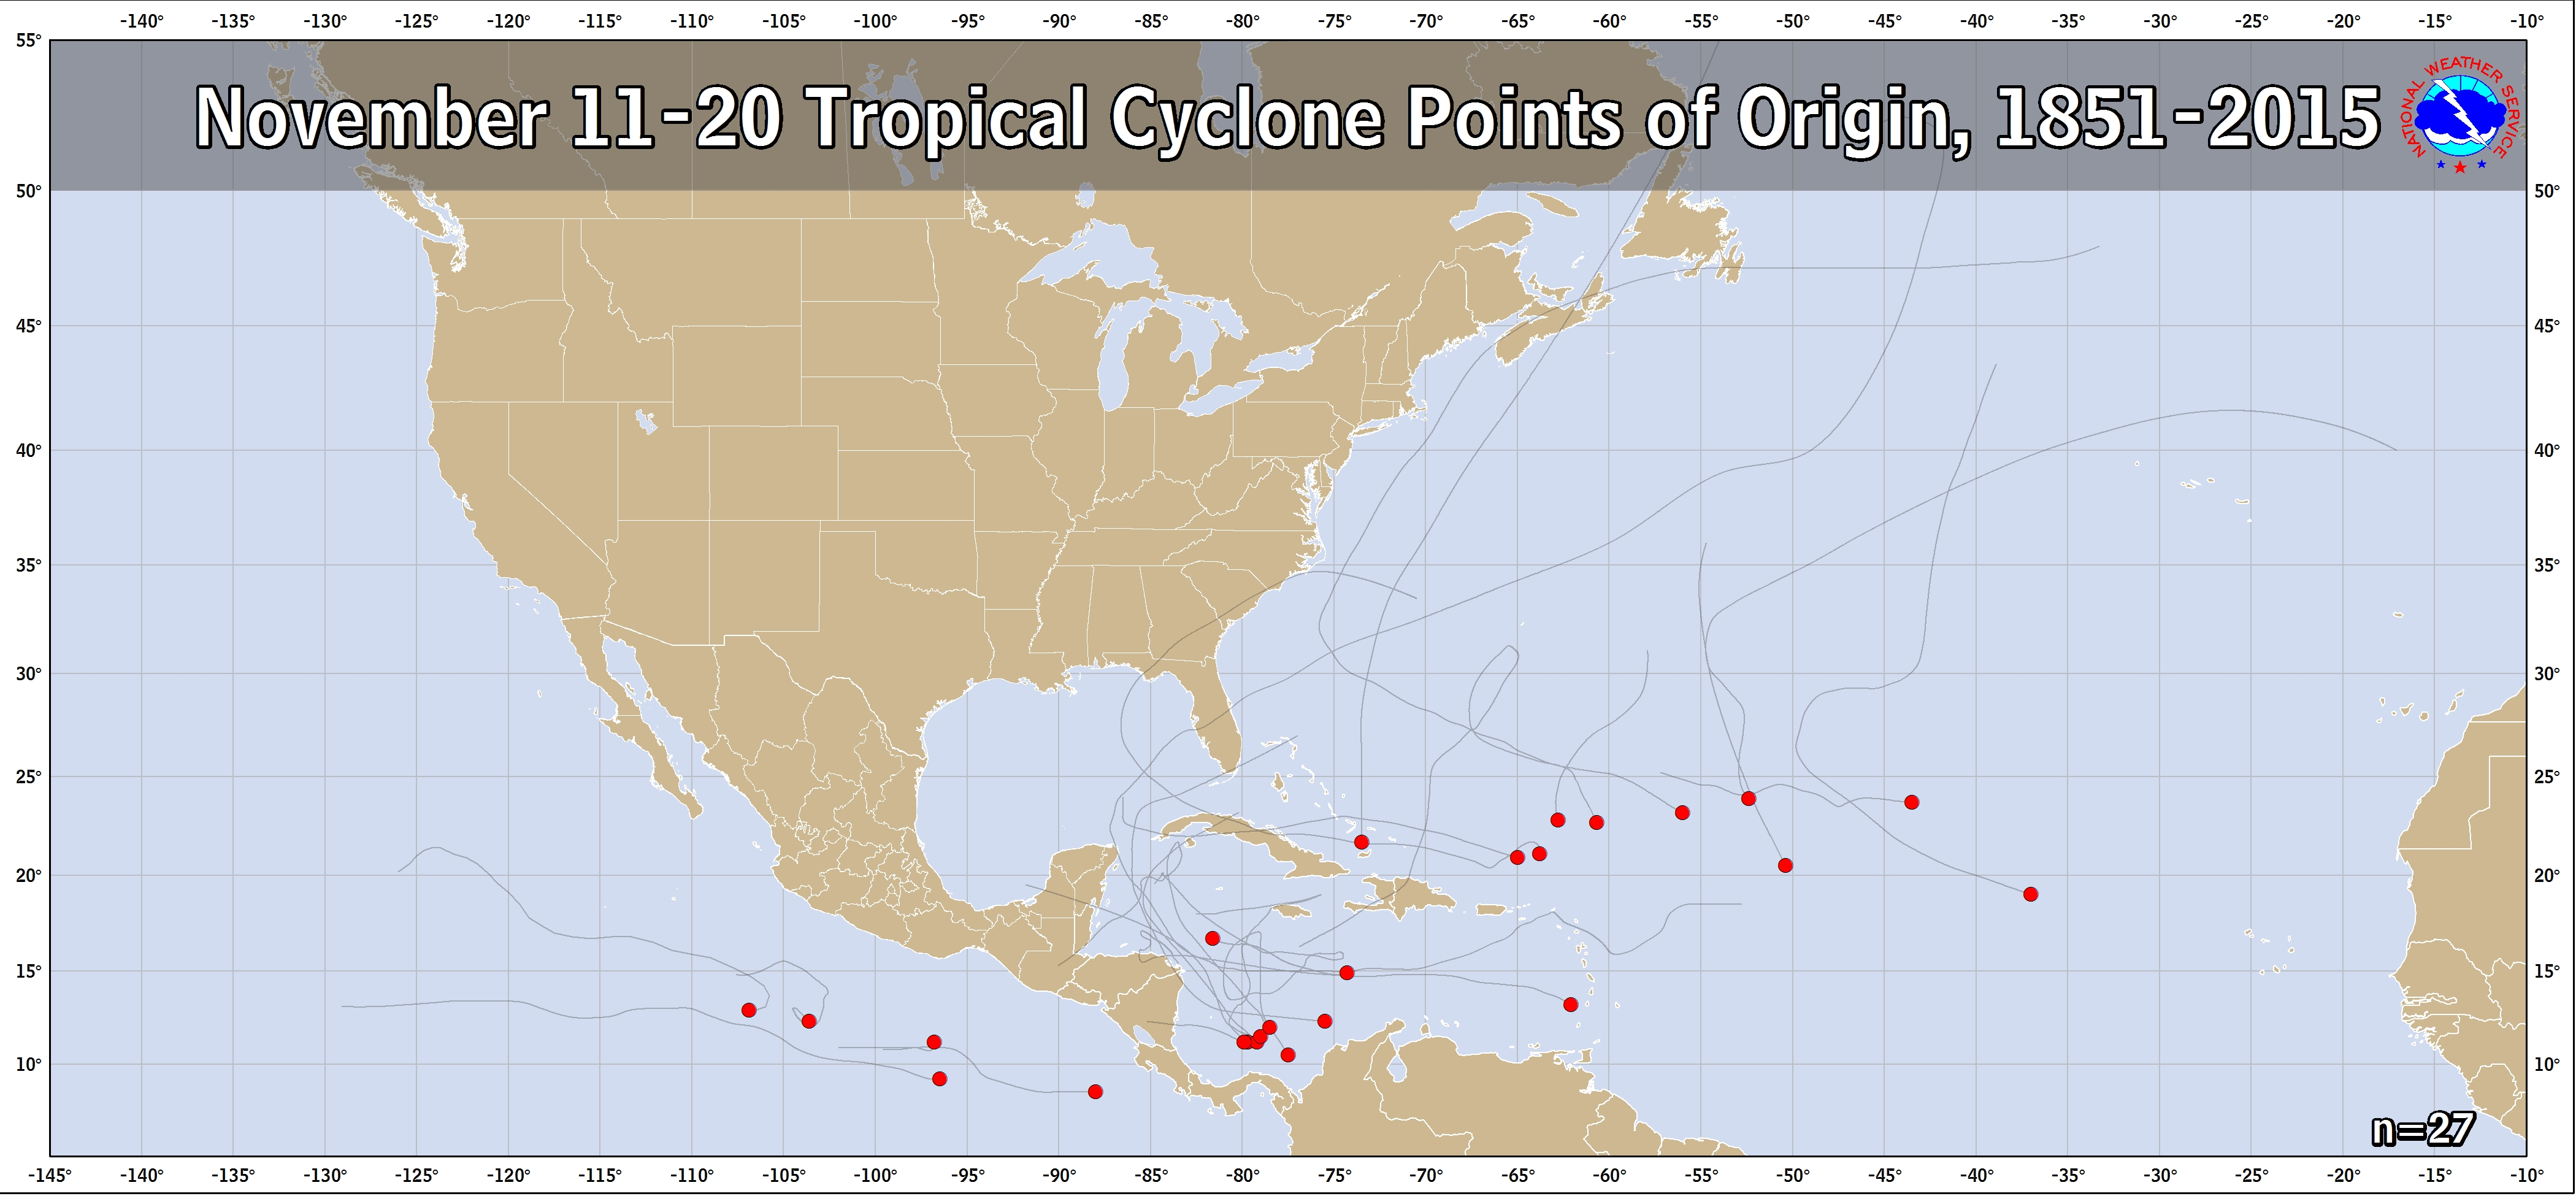
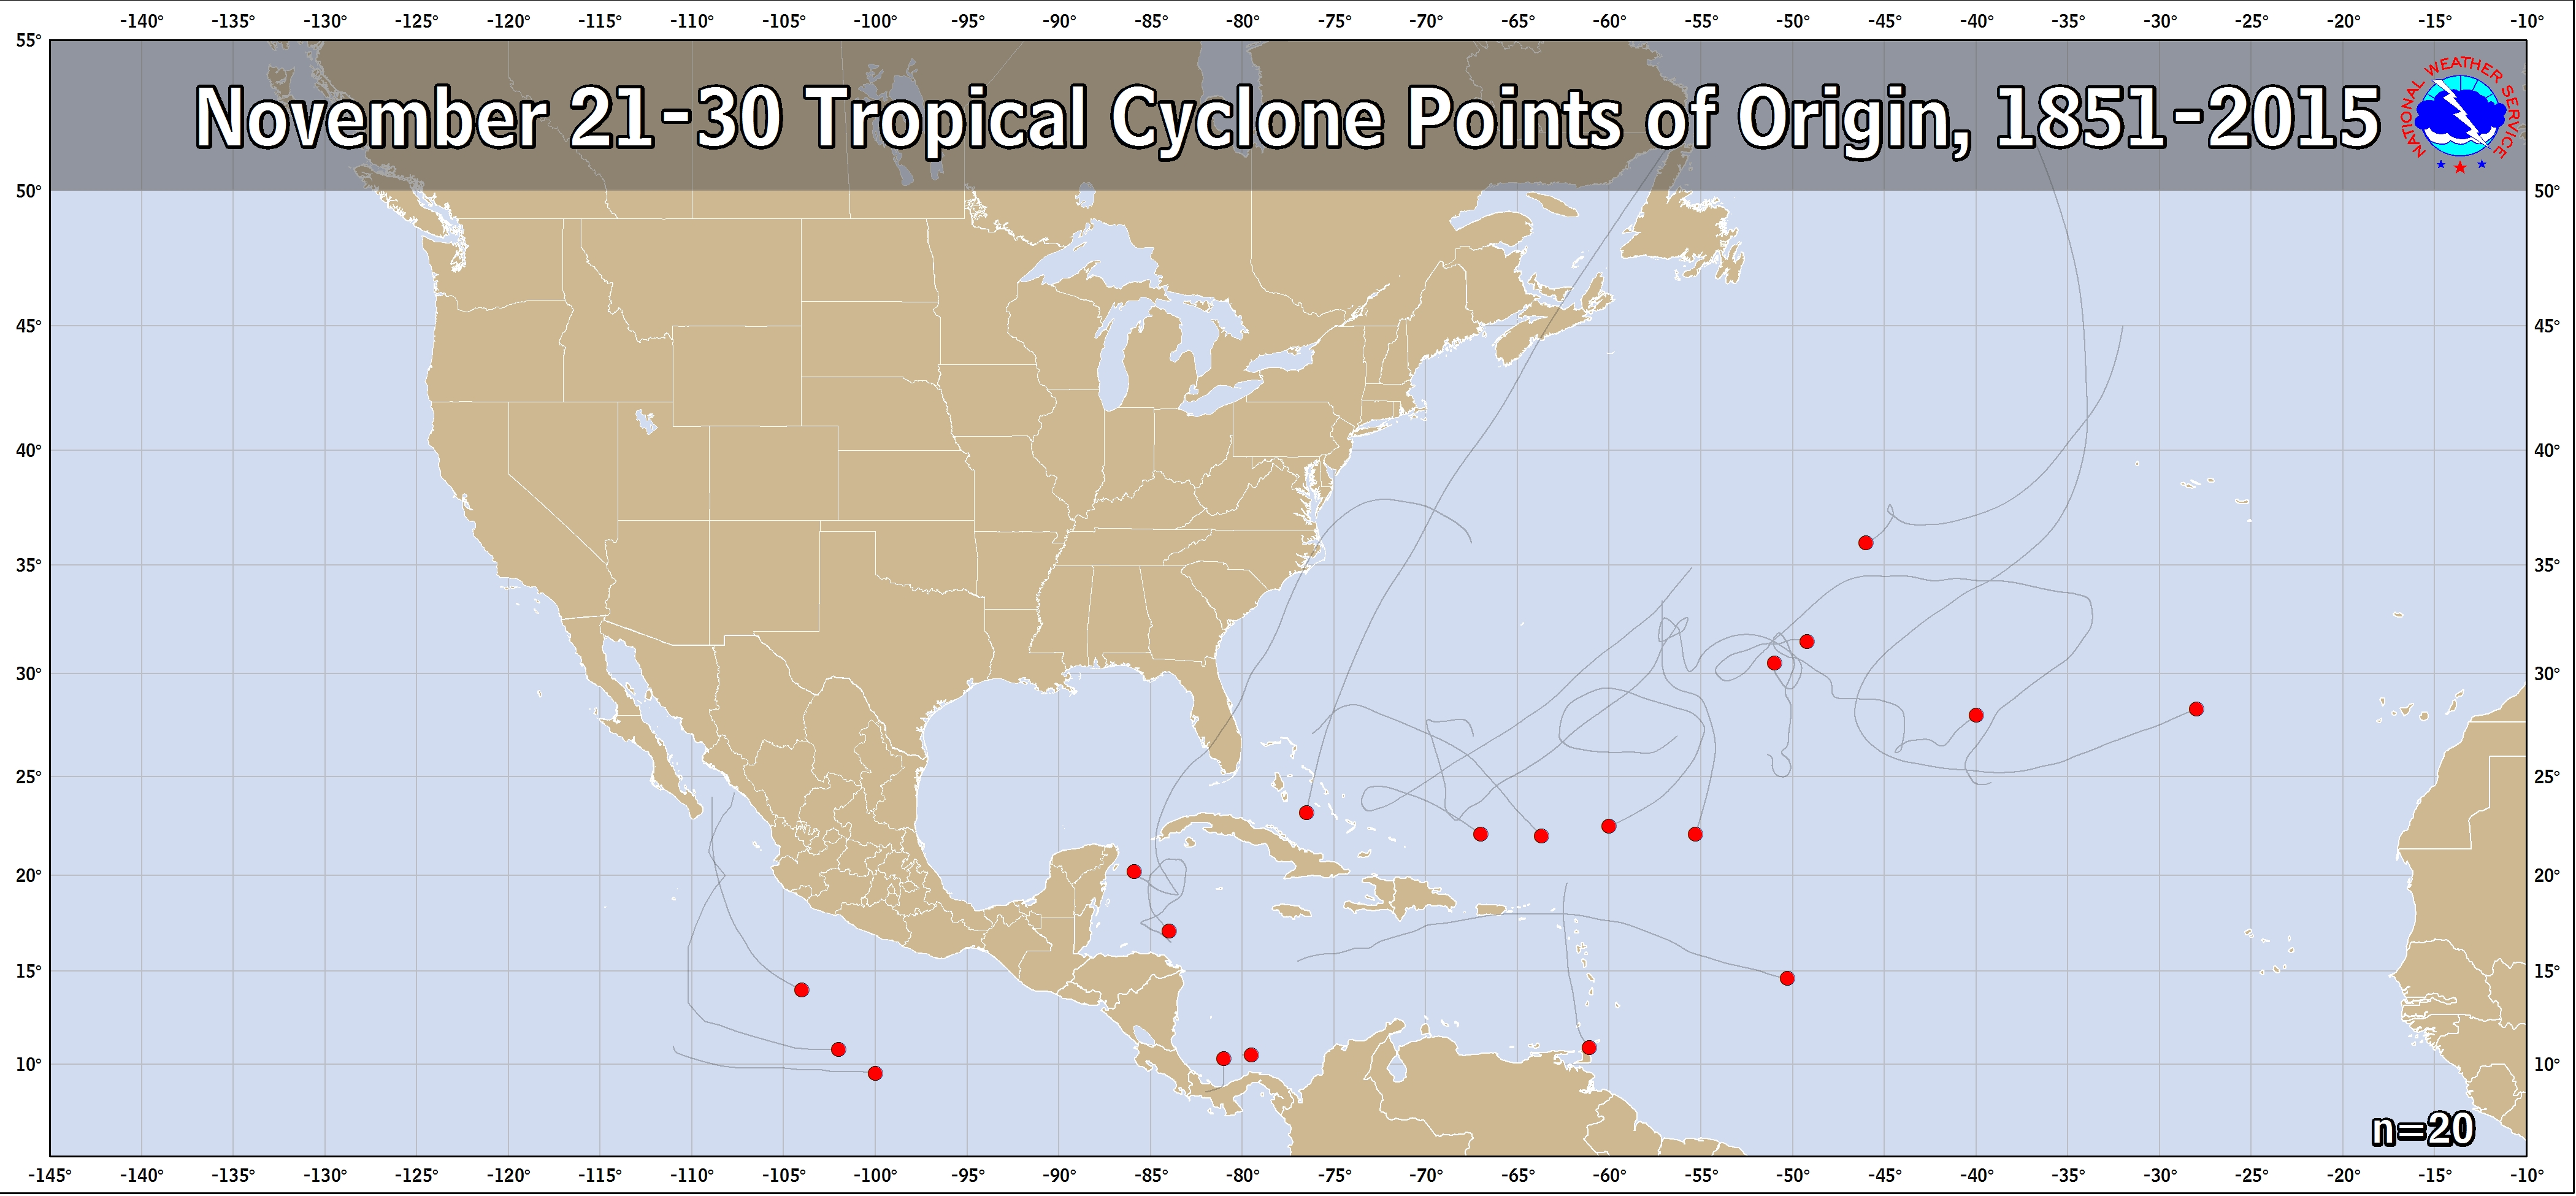
The figures below show the points of tropical cyclone genesis by 10-day periods during the hurricane season. These figures depict named storms only; no subtropical storms or unnamed storms. The source years include 1851-2009 for the Atlantic and 1949-2009 for the Eastern Pacific from the HURDAT database.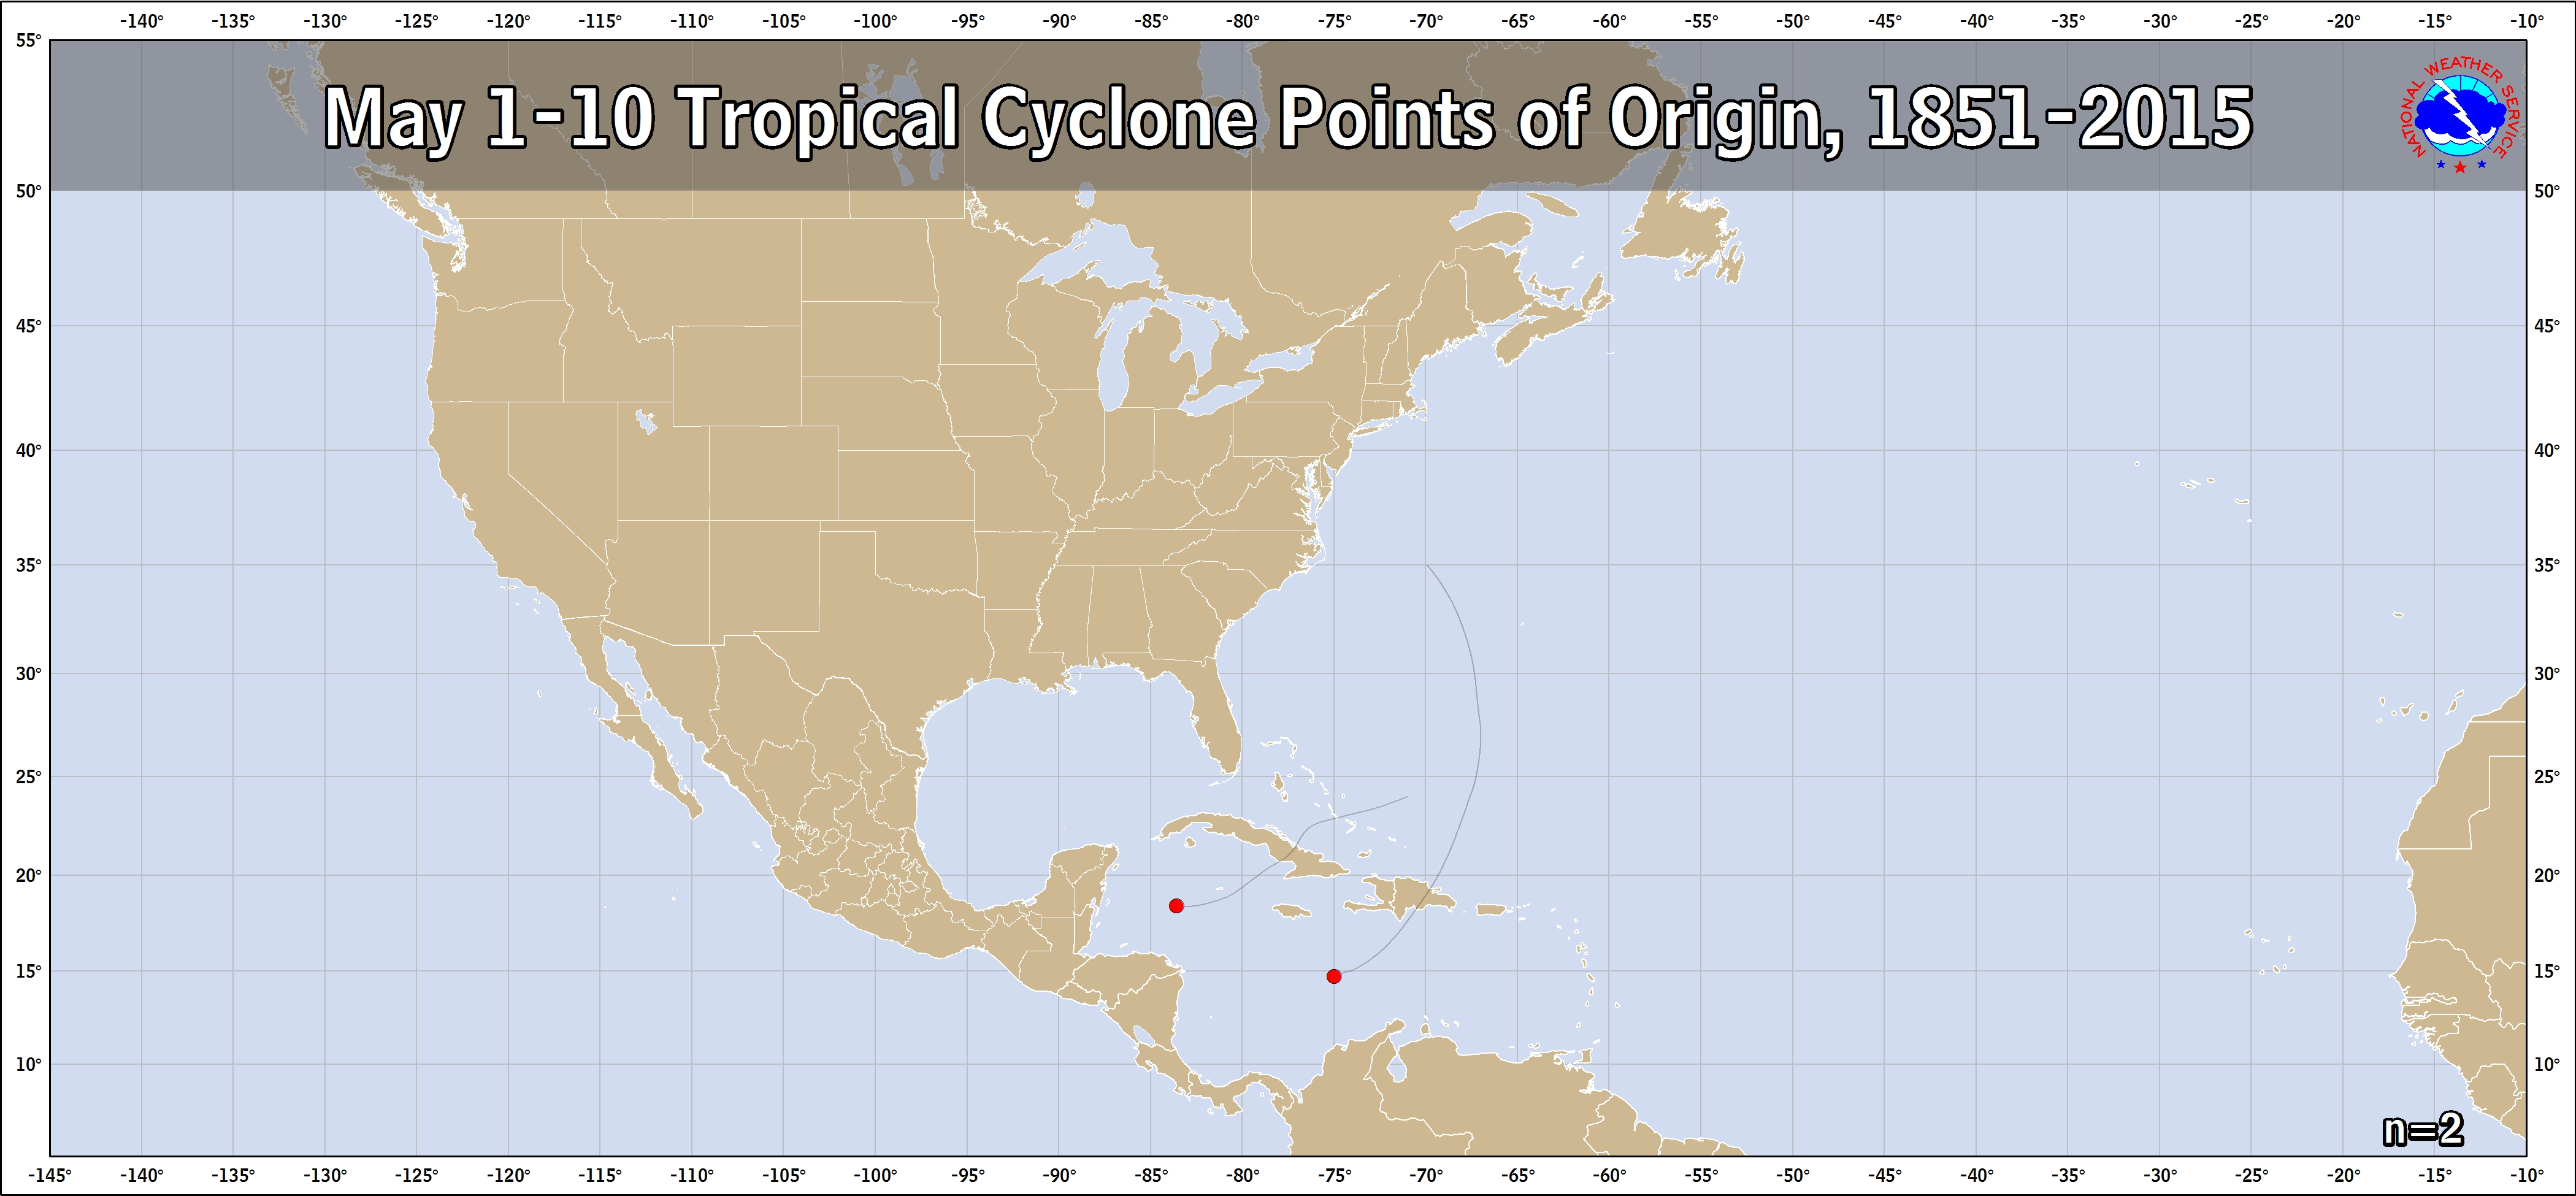
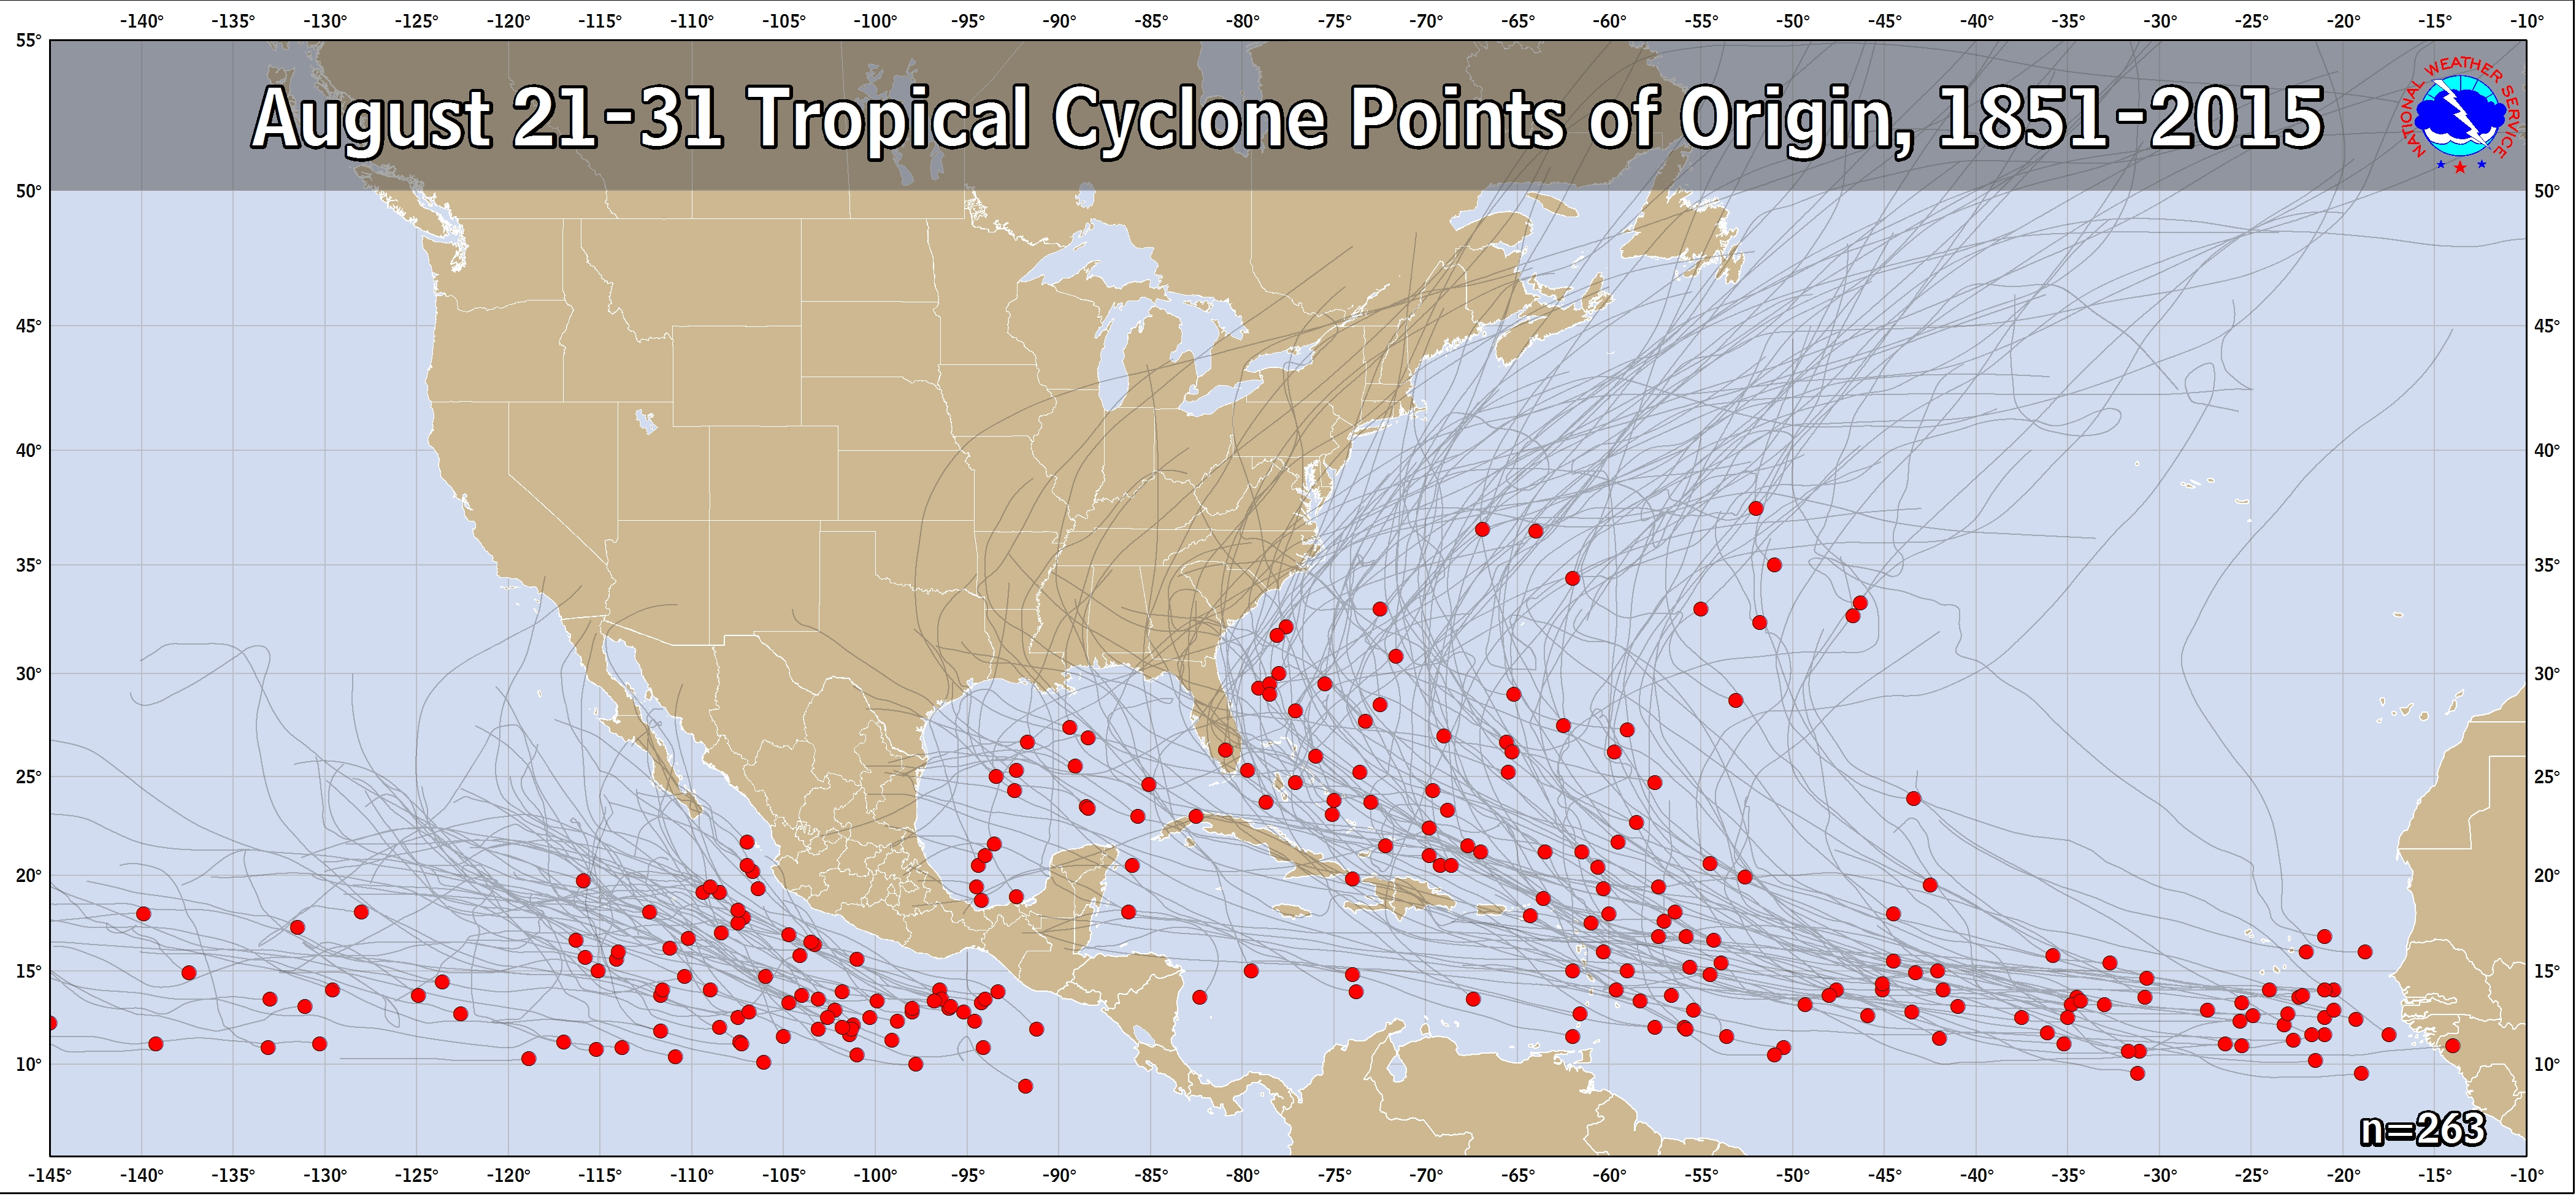
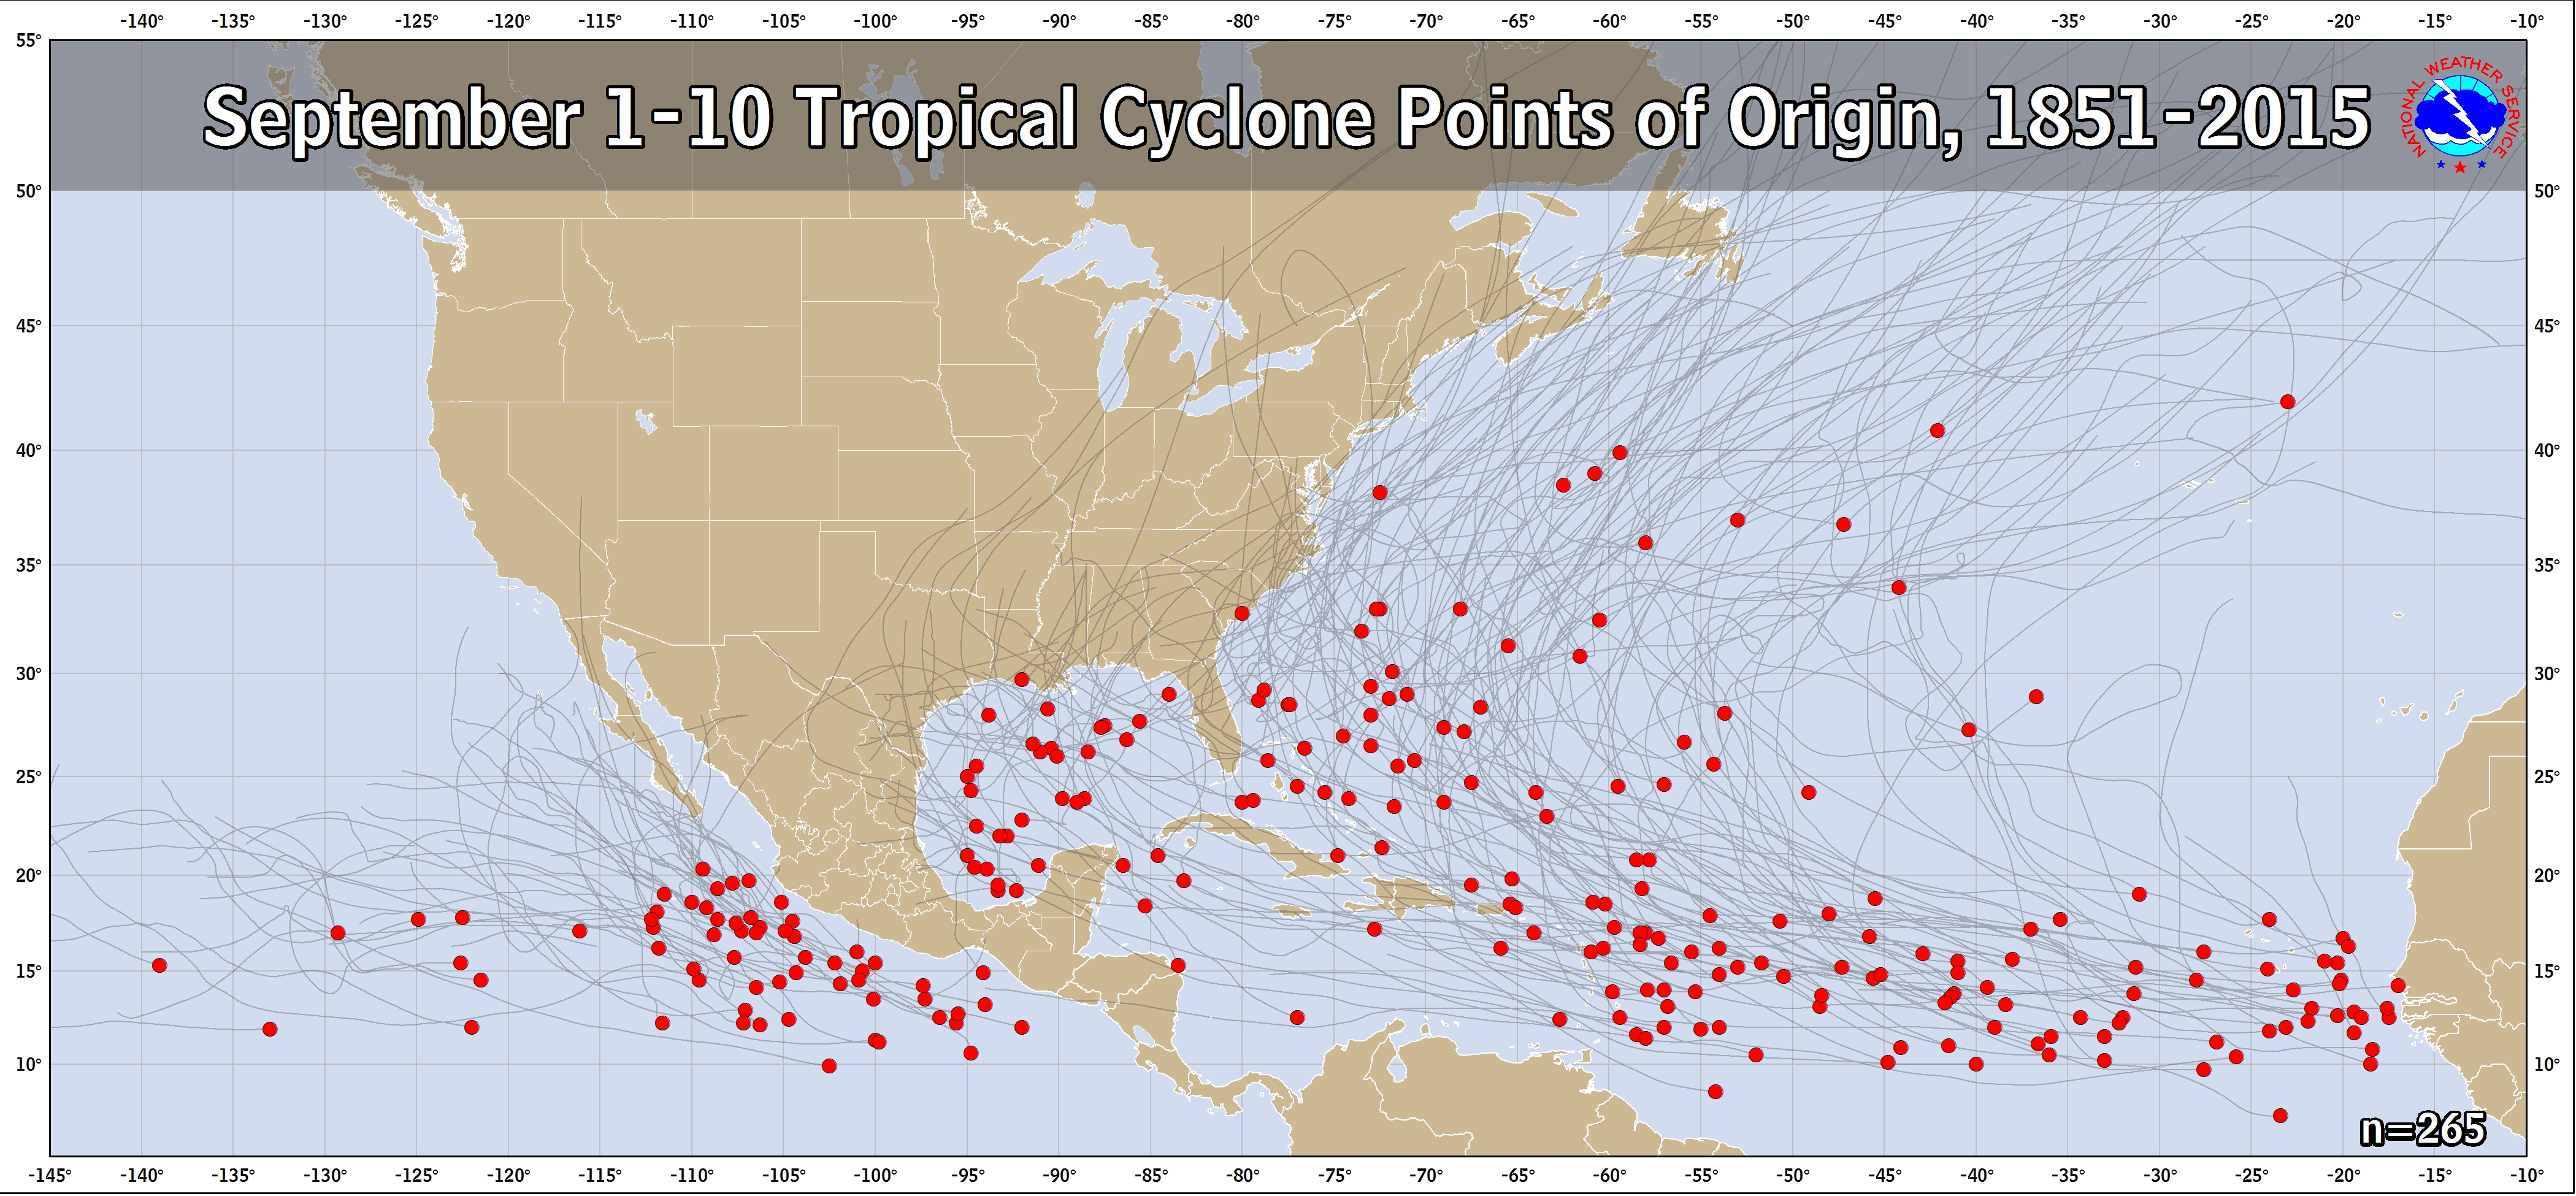
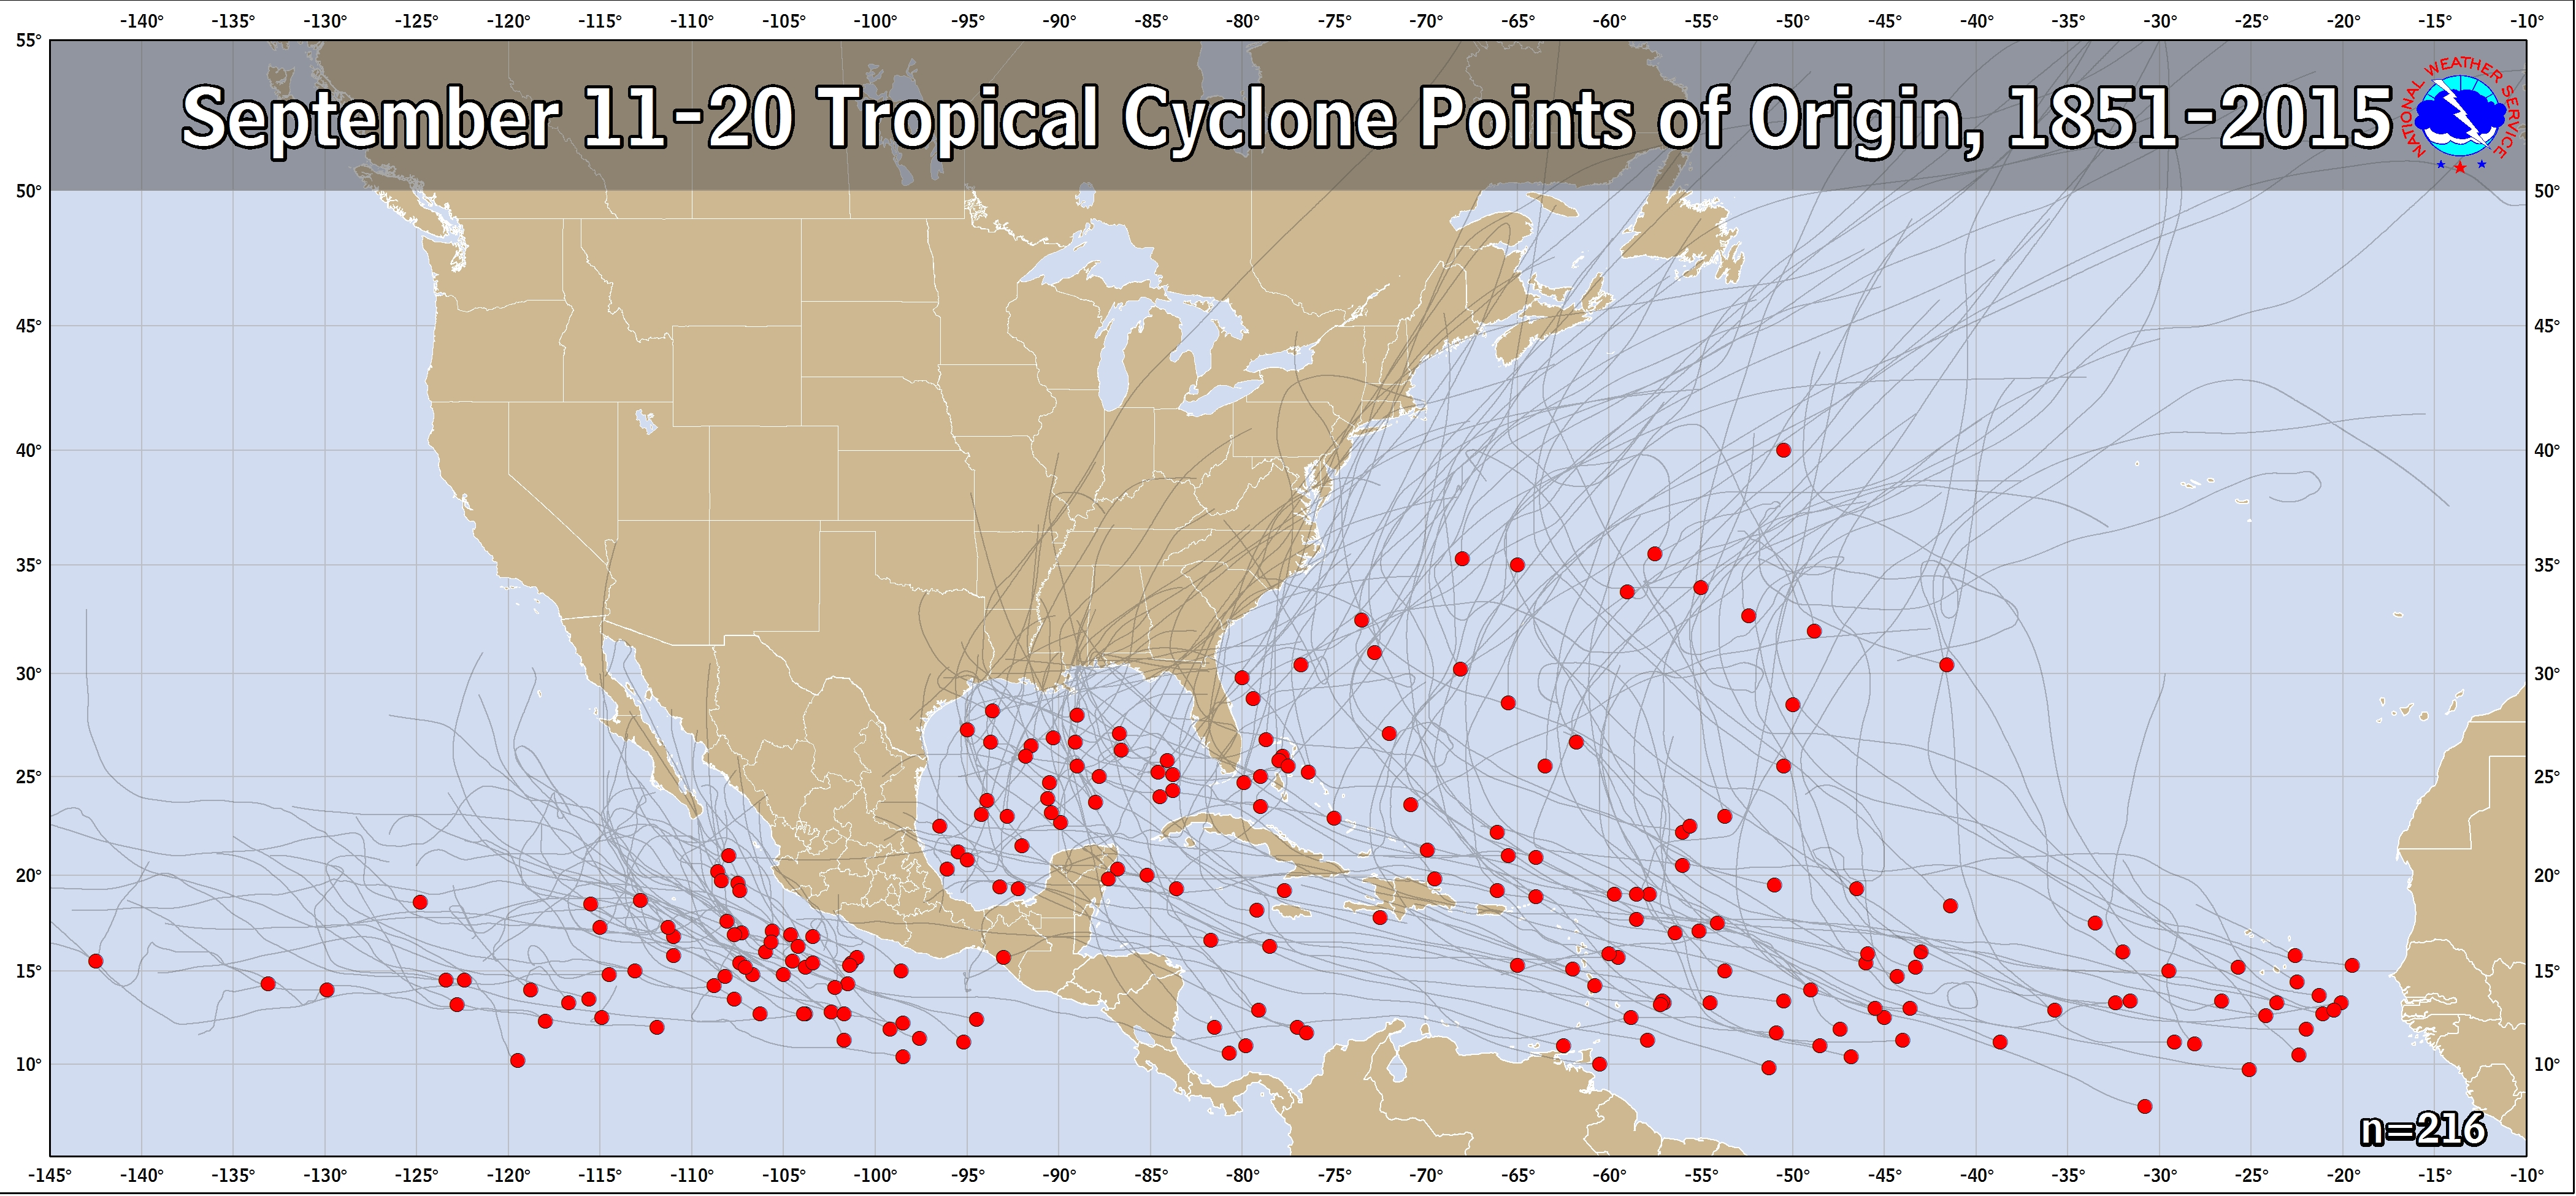
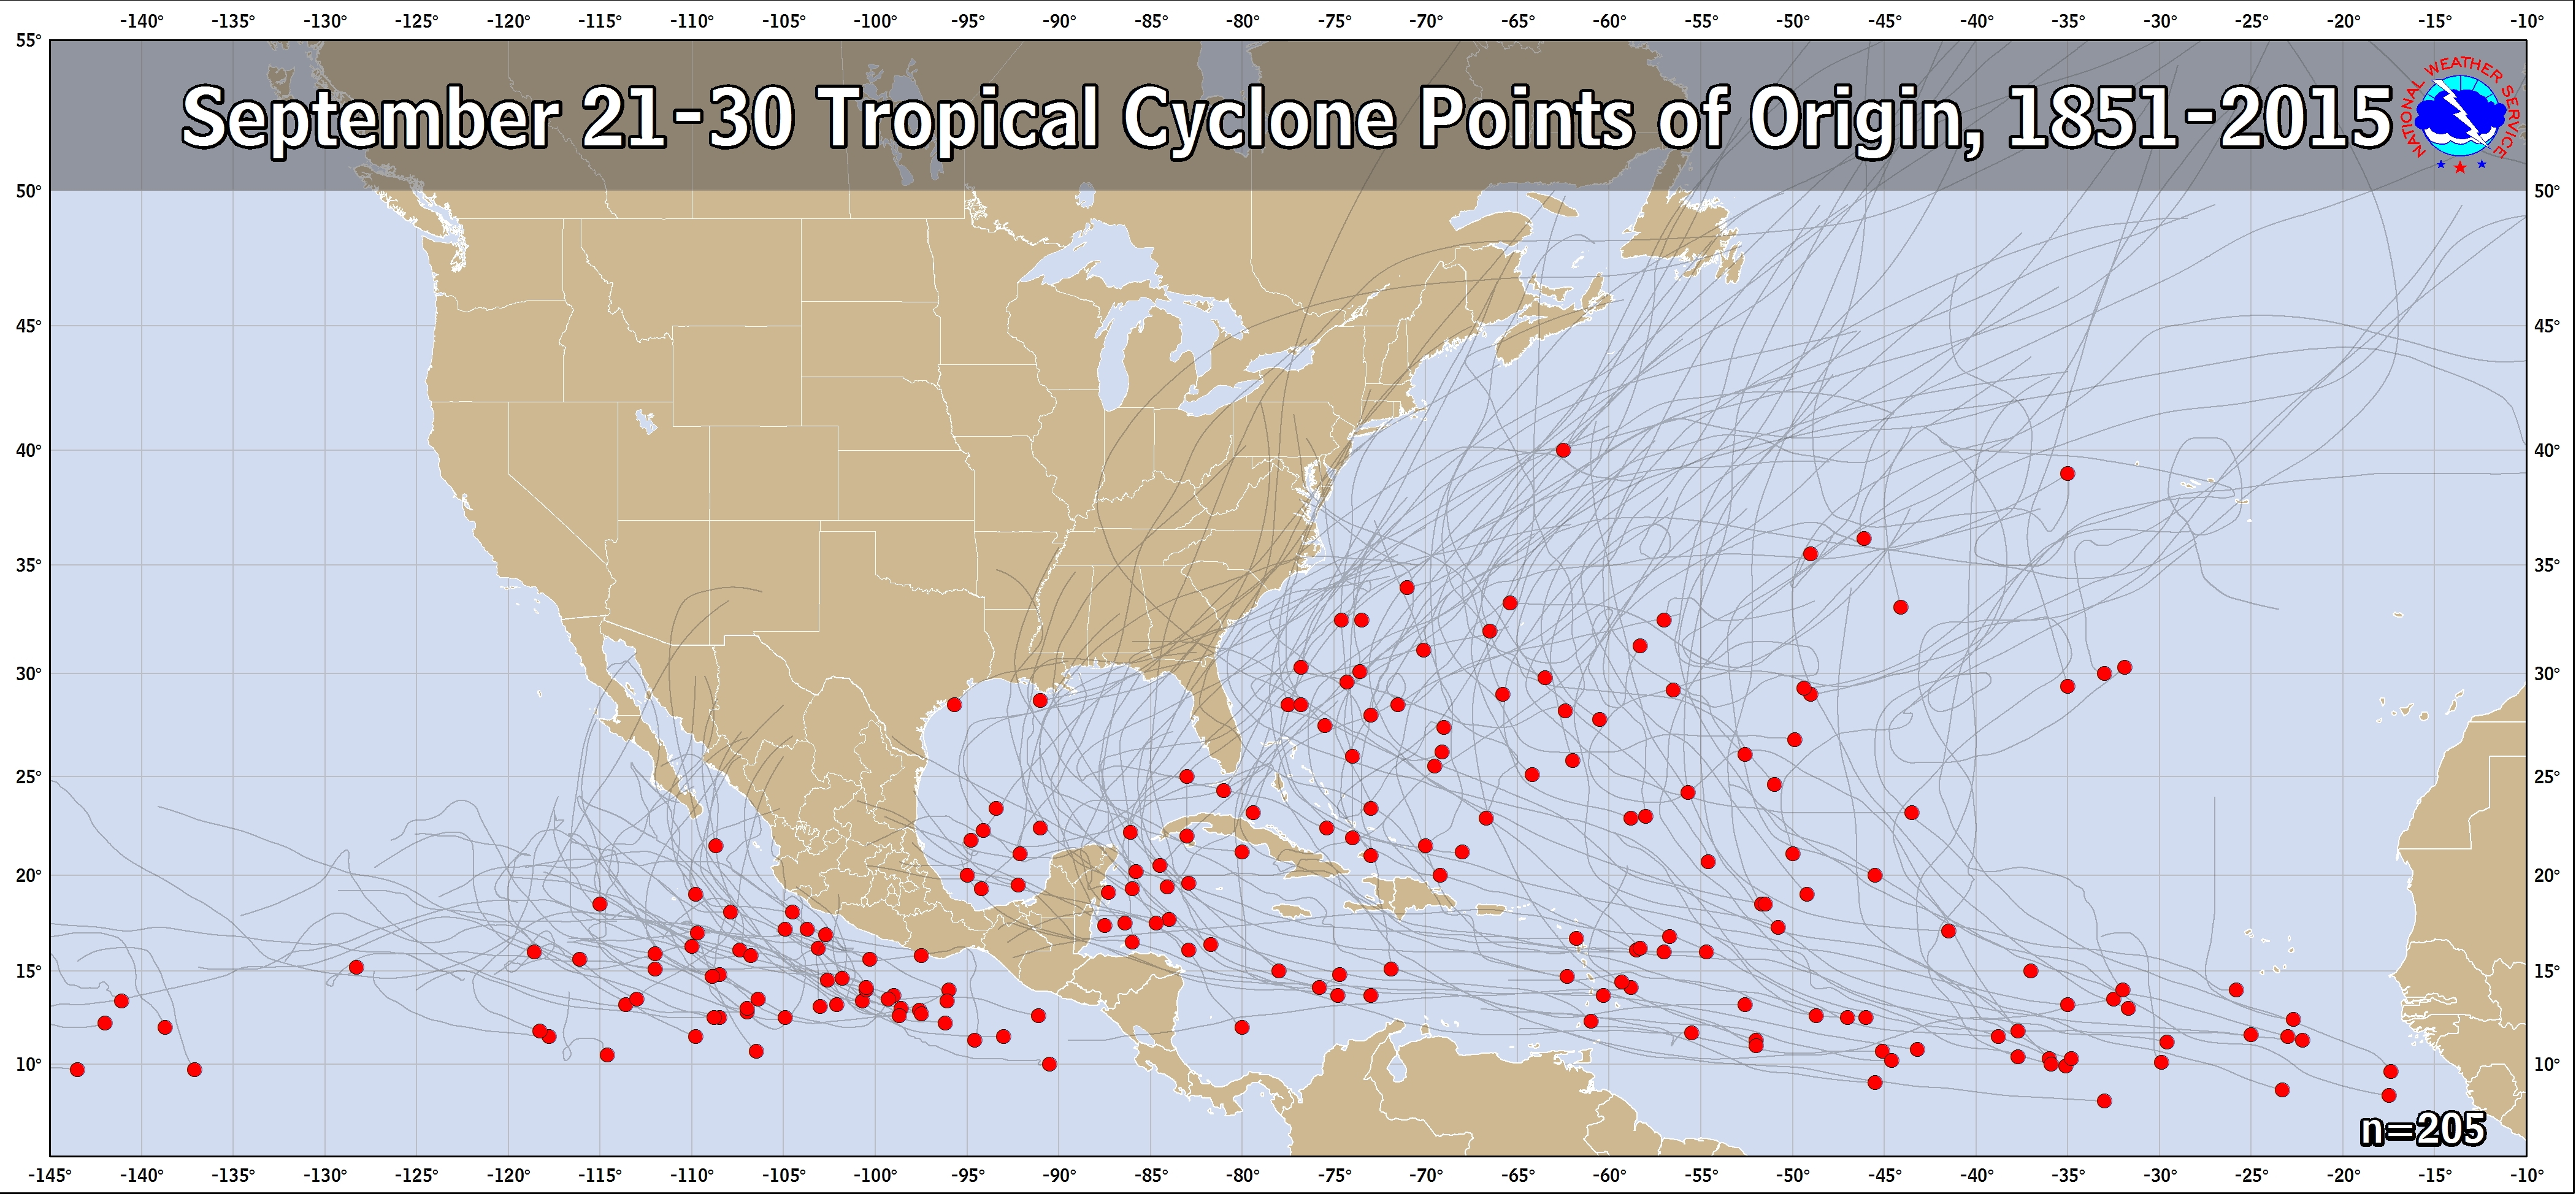
Climatological Areas of Origin and Typical Hurricane Tracks by Month
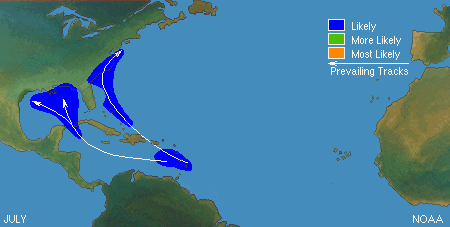
The figures below show the zones of origin and tracks for different months during the hurricane season. These figures only depict average conditions. Hurricanes can originate in different locations and travel much different paths from the average. Nonetheless, having a sense of the general pattern can give you a better picture of the average hurricane season for your area.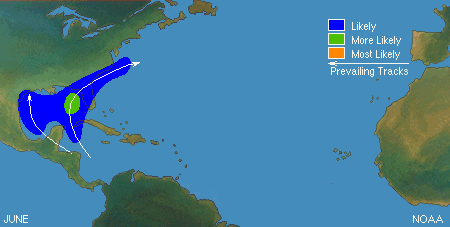
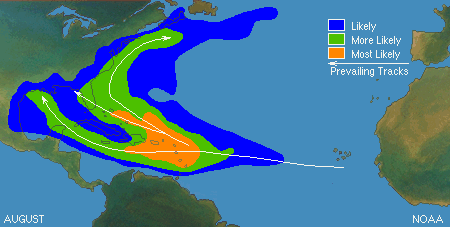
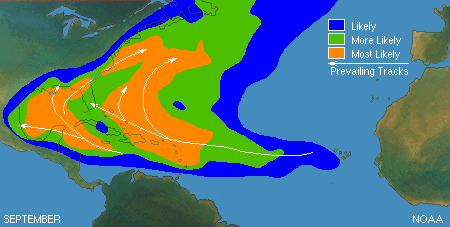
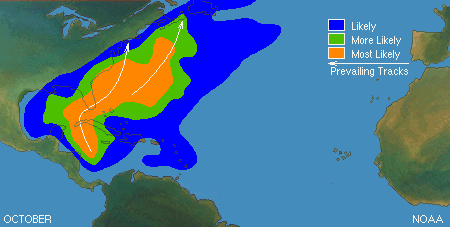
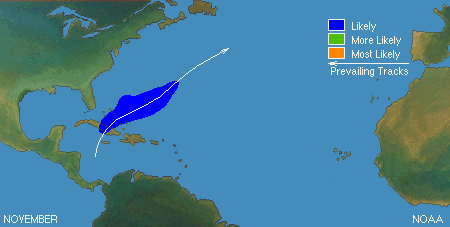
High Resolution History Maps
![[Tropical Cyclone History Map for Atlantic and Eastern Pacific]](http://www.nhc.noaa.gov/climo/images/1851_2013_tc.jpg)
![[Hurricane History Map for Atlantic and Eastern Pacific]](http://www.nhc.noaa.gov/climo/images/1851_2013_hurr.jpg)
![[Major Hurricane History Map for Atlantic and Eastern Pacific]](http://www.nhc.noaa.gov/climo/images/1851_2013_mjrhurr.jpg)
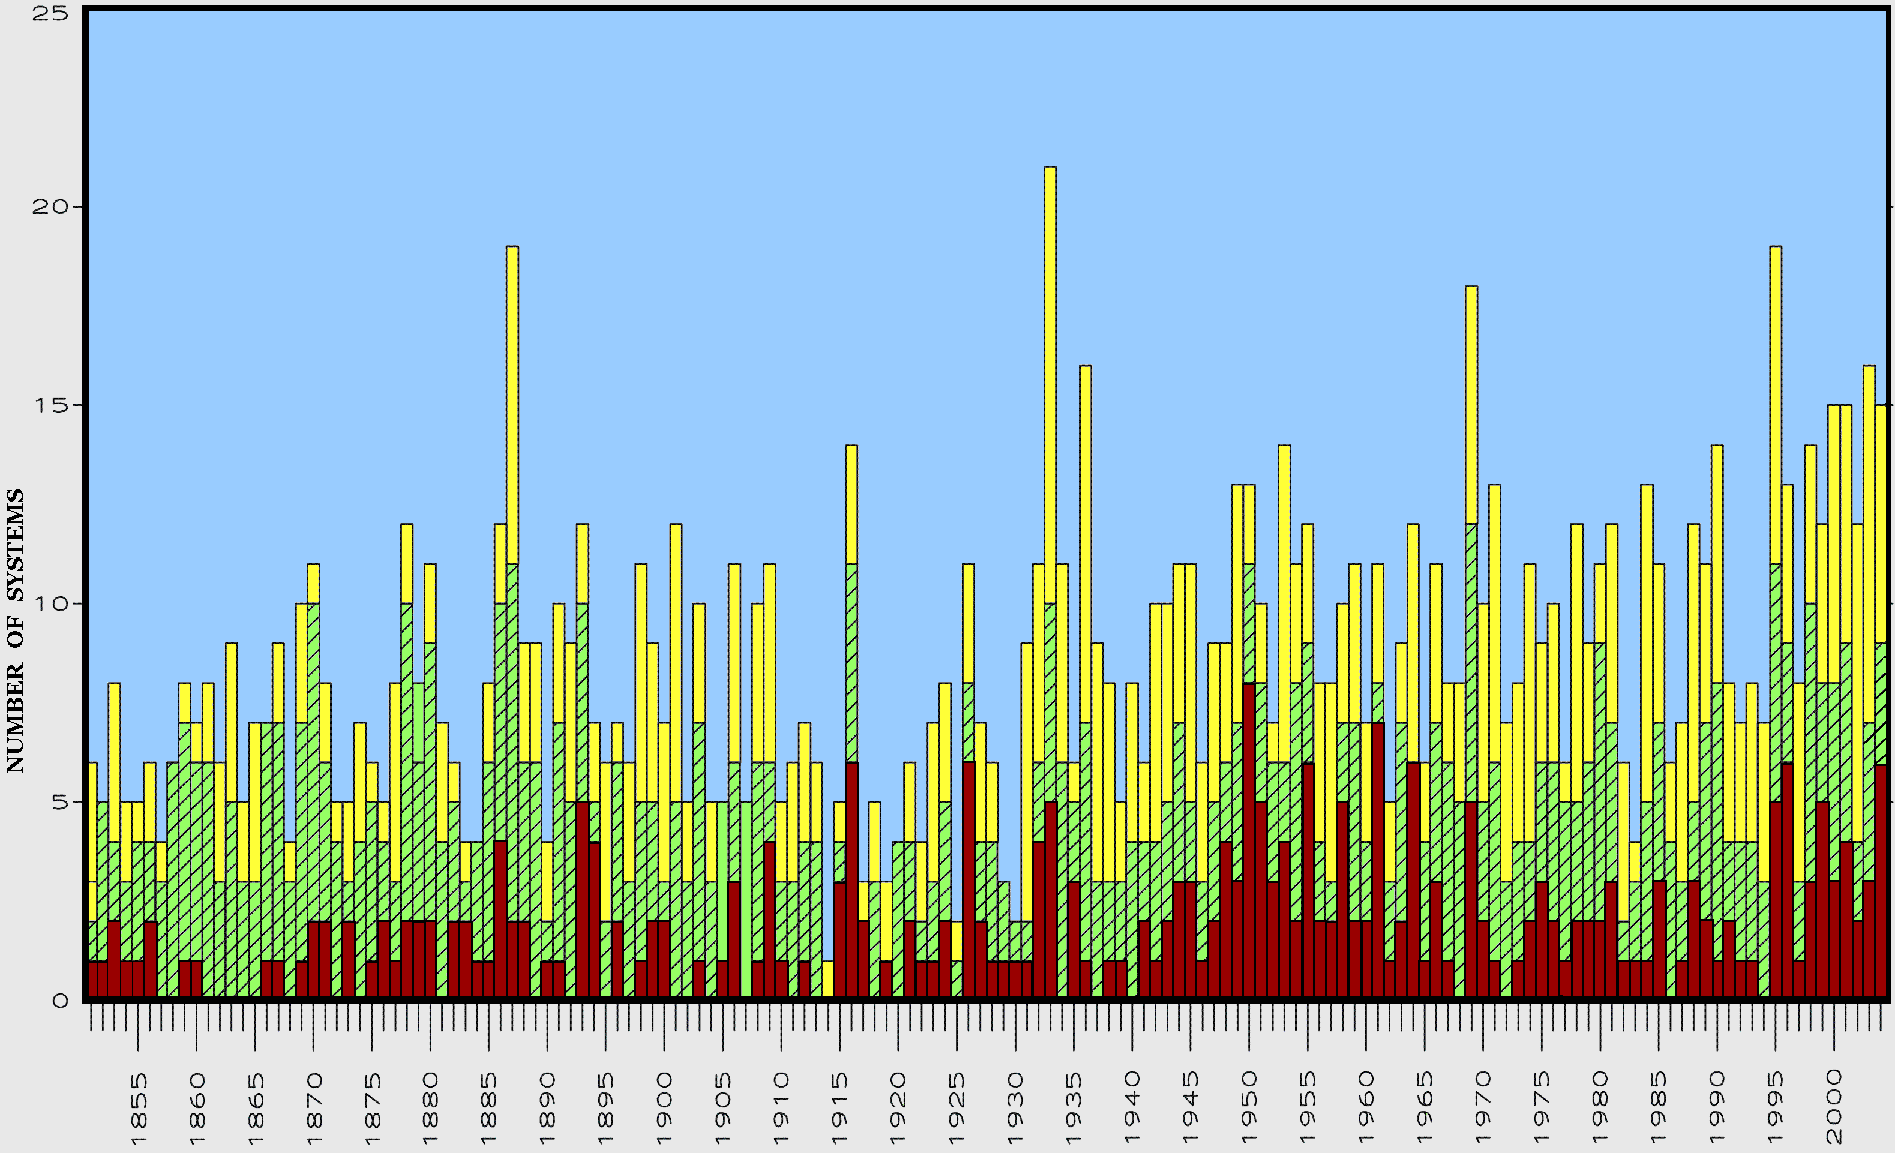
Named Cyclones by Year
![[Graph of Tropical Cyclone Activity in the Atlantic Basin]](http://www.nhc.noaa.gov/climo/images/atlhist_lowres.gif)
Hurricane Return Periods
Hurricane return periods are the frequency at which a certain intensity of hurricane can be expected within a given distance of a given location (for the below images 50 nm or 58 statute miles). In simpler terms, a return period of 20 years for a major hurricane means that on average during the previous 100 years, a Category 3 or greater hurricane passed within 50 nm (58 miles) of that location about five times. We would then expect, on average, an additional five Category 3 or greater hurricanes within that radius over the next 100 years.
More information on return periods can be found from NOAA Technical Memorandum NWS NHC 38 (pdf) on the NHC Risk Analysis Program (HURISK).
Note: The information on return period is generated with the 1987 HURISK program, but uses data through 2010.
![[Map of return period in years for hurricanes passing within 50 nautical miles]](http://www.nhc.noaa.gov/climo/images/return_hurr.jpg)
![[Map of return period in years for major hurricanes passing within 50 nautical miles]](http://www.nhc.noaa.gov/climo/images/return_mjrhurr.jpg)
CONUS Hurricane Strikes
![[Map of 1950-2011 CONUS Hurricane Strikes]](http://www.nhc.noaa.gov/climo/images/conus_hurrStrikes_1950-2011.png)